Technically The Market Is In A Pickle
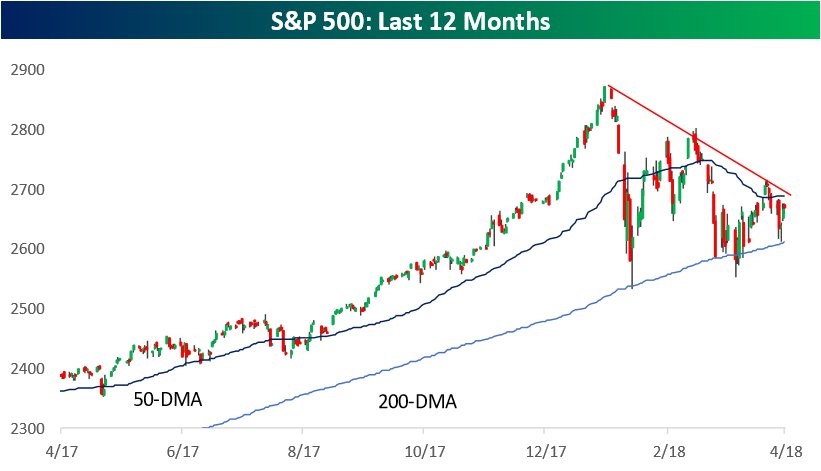
The S&P 500 was down 0.82% on Monday despite the fabulous earnings results. Some investors are looking for Apple’s earnings after the bell on Tuesday to turn the tide, but I think that’s a dubious hope. Even if it beats estimates, one stock can’t turn the market especially since the other FAANG names couldn’t do it. The chart below shows the technical analysis I’m following. It’s a situation that’s about to resolve itself soon as the market keeps making lower highs, but has not breached the February low. Furthermore, the 50 day moving average has acted as a ceiling and the 200 day moving average is acting as a floor.
Everything is converging into one point as the 50 day moving average and 200 day moving average get closer and the lower highs become closer to the February low. The pivotal point will likely come in May or June, making every data point and Fed meeting critical. It’s definitely possible that the conclusion is already foregone since we are near the end of the cycle. I have been bullish at the bottom end of this range and bearish at the top end because of the fundamentals, but the technicals are looking dicey.
Inflation Could Force The Fed’s Hand
The March PCE report was released Monday. I think this report is the most important indicator I follow because we are on inflation watch with the Fed shifting into a hawkish gear. It doesn’t take the Fed long to push the economy into a recession after raising rates excessively. Each rate hike pushes up the odds for a recession in 2019 or 2020. Personal income growth was 0.3% month over month which was the same as last month and missed expectations by one tenth. Consumer spending growth was 0.4% which met estimates. Consumer spending was still weak in March as was shown in the GDP report. The PCE price index was flat month over month which missed estimates by a tenth. It was up 2% year over year. The all-important core PCE was up 0.2% month over month which met estimates. It was up 1.9% year over year which was one tenth below estimates.
This was a tepid inflation report compared to estimates, but it showed the inflation story is in tact which worries the market. I was expecting core PCE to be up 1.8% or 1.9% based on the core CPI report. We are now just one tenth below the Fed’s mandate which is likely getting some at the Fed worried. The Fed sees the recent employment cost index showing 2.7% growth and rising oil prices and responds by getting more hawkish. The CRB commodities ETF is very close to the highest point since October 2016. It’s still not heated compared to 2014 as it peaked at $313 and it’s now at $202. The more momentum this index gets, the higher rates go and the more compressed margins get. PE multiples compress in advance of this cyclical phase change, like what’s happening now.
The Fed Meeting On Wednesday Should Be Hawkish
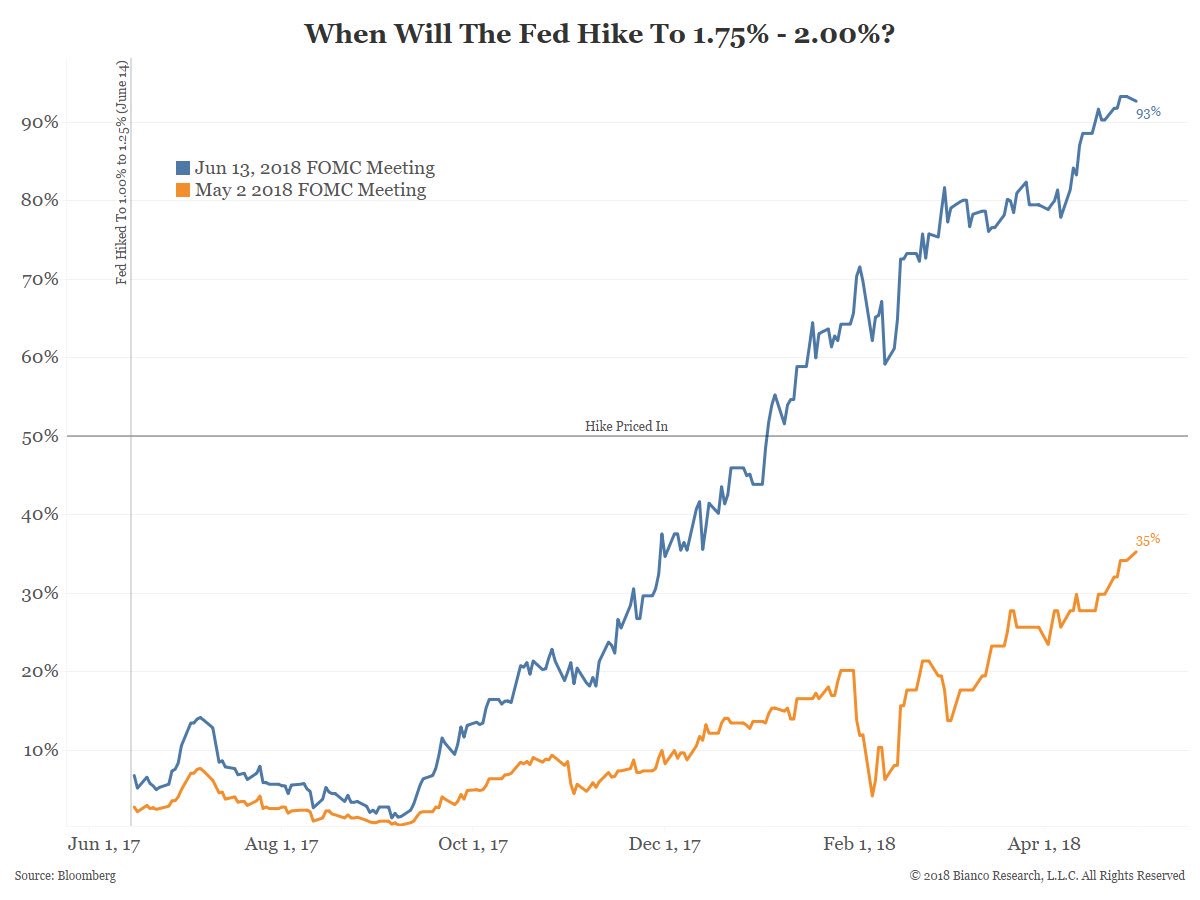
As you can see from the chart below, the odds of a rate hike in the May meeting are creeping up. The Fed will follow where the core PCE heads. I’m interested to see if the Fed mentions the weakness in consumer spending in Q1 or if it goes full bore on the inflation narrative. Unfortunately, the Fed is in a tough position because inflation is perking up and the economy is weakening. This elicits fear of the ‘stagflation’ buzzword, but we’re far from having enough inflation to meet that definition. If the Fed were to raise rates and add hawkish commentary, it could send the market into a tailspin because of how fragile the economy is. This entire expansion has been fragile; the weakening periods like the one we are in now are especially troublesome. The Fed supported the market in the last 3 weak periods, but now it is actively hawkish.
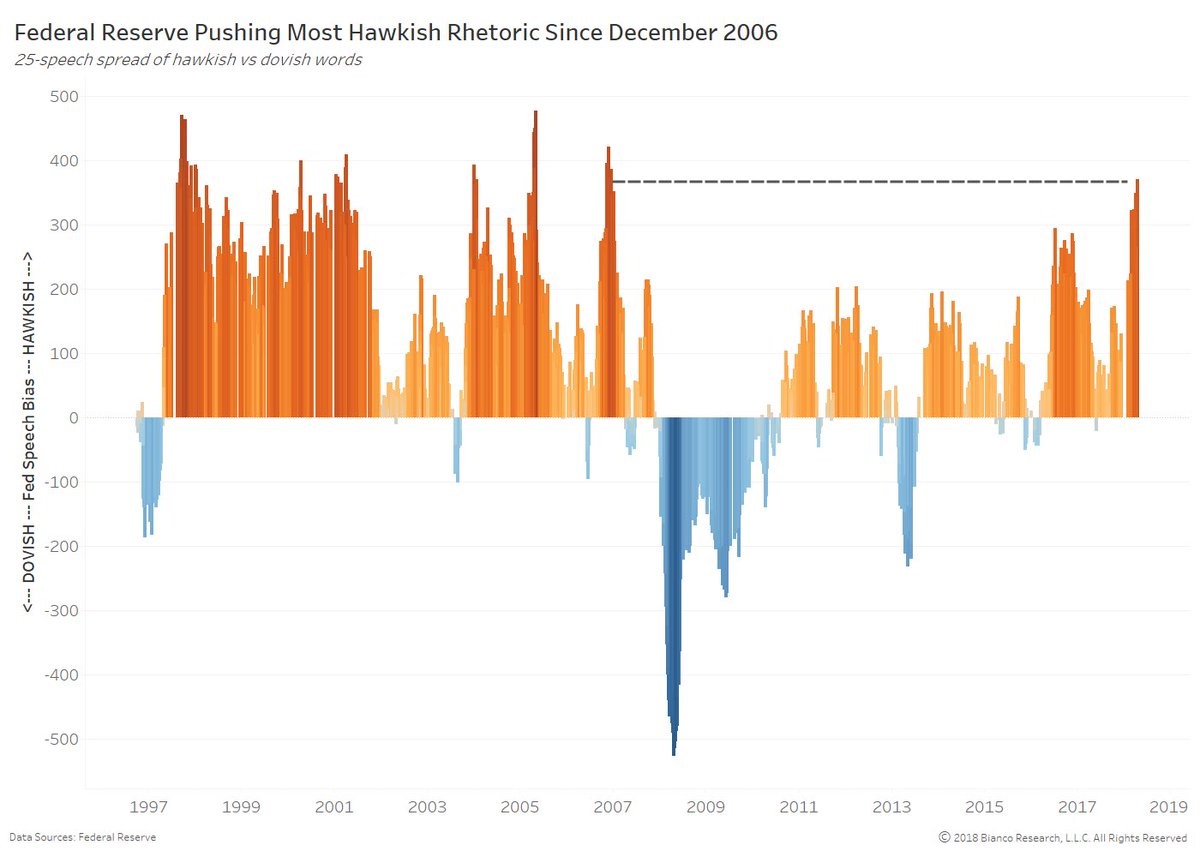
The latest difference between the 10 year yield and the 2 year yield is 46 basis points. Given how weak the economy is, I’d argue that the yield curve is a beacon of strength. Some argue that the curve won’t invert this cycle, but I disagree because of the Fed’s dedication to get the funds rate high enough so it can be significantly cut in the next recession. As you can see from the chart below, in prior slowdowns the Fed switched to dovish language, but in this slowdown the Fed is the most hawkish since December 2006. This has been a slow hike cycle; for much of it the Fed has been only moderately hawkish.
This chart is important because the Fed’s language and the data dictate where the Fed fund futures will go. The more rate hikes in the next 18 months, the higher the chance of a recession. The Fed has been able to elongate this expansion by avoiding getting too hawkish during slowdowns. The two differences between this slowdown and the others are that the tax cuts are disguising the economic weakness and that the labor market is filling up which is making inflation more sustainable. The tax cut should boost growth in theory, but the 2.3% GDP growth rate in Q1 suggests otherwise. The labor market may not be filled yet, but it’s certainly more filled than it was during the slowdown in 2015-2016.
Conclusion
The S&P 500 will be facing interesting technical levels in the coming weeks. The lower highs are disconcerting. The market wouldn’t need to rally much to get to a higher high, yet it keeps failing to do so despite the great headline earnings and sales beats. If the Fed goes with a surprise hike in May, the market could easily fall below the February low. The one saving grace for the market might be that as earnings season comes to a close, firms are exiting their blackout period to buyback their shares.