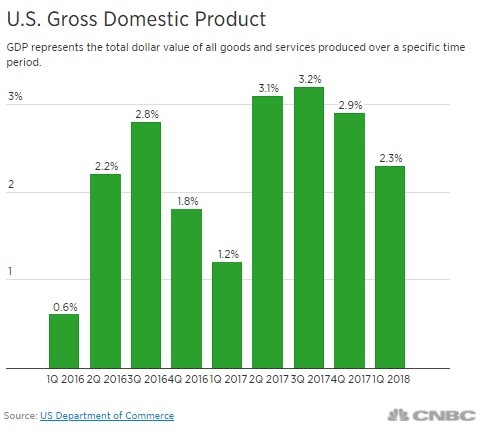
GDP Growth Is 2.3%
Real GDP growth was almost exactly in the middle of my GDP growth forecast as it was 2.3%. Let’s quickly bury the narrative that this first quarter was the quickest Q1 since 2015. That analysis doesn’t make sense because it’s illogical to compare quarter over quarter growth on a year over year basis. This is a distraction from the point that growth decelerated. Just because growth decelerated in Q1 in the past 3 years, doesn’t mean this is somehow a great result. You can see the two consecutive quarters of deceleration from Q3 2017. This result may be revised, but it’s doubtful that it will get to 2.9%.
The Details Are Weak
The chart below shows the GDP component breakdown. There was a big swing in inventories which I’ve talked about in previous articles. It added 0.43% to GDP; it subtracted 0.53% from GDP in Q4. The improvement in inventories occurred because of solid demand growth last year. To me, it’s a lagging indicator which signals this report was worse than the headline suggests.
Trade also helped GDP growth instead of hurting it. Exports went from helping GDP 0.83% last quarter to helping it by 0.59%. The imports hurt GDP by 0.39% instead of 1.99%. Trade added 0.2% to GDP instead of subtracting 1.2% from growth. This is another bad sign because it means trade growth slowed. President Trump’s plan is to shrink the trade deficit. That occurred in March. In the past few decades high growth has been paired with high deficits. We’ll see if this is a new phase change or if this signals a slowdown in the global economy. Since we’ve been seeing weakness in Europe, I chose to believe this is related to the slowdown. The data in April will give us a better understanding of the tariffs.
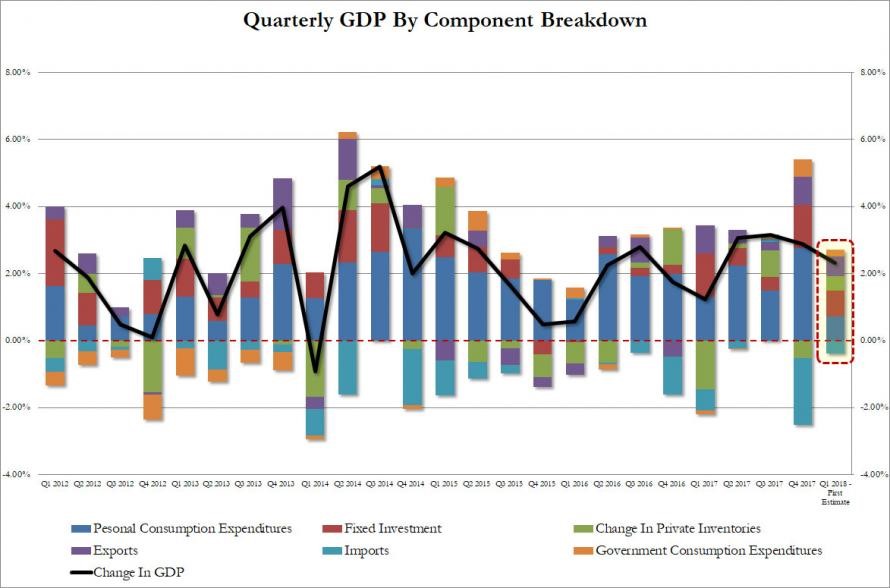
Fixed investment helped GDP by 0.76% versus 1.31% last quarter. The one bright point of this report is government spending added 0.2% to growth instead of 0.5%. Like I just mentioned, I wouldn’t claim Trump’s stances have directly catalyzed the changes in this report. The recent omnibus spending bill should increase government’s effect on GDP, but the opposite occurred this quarter.
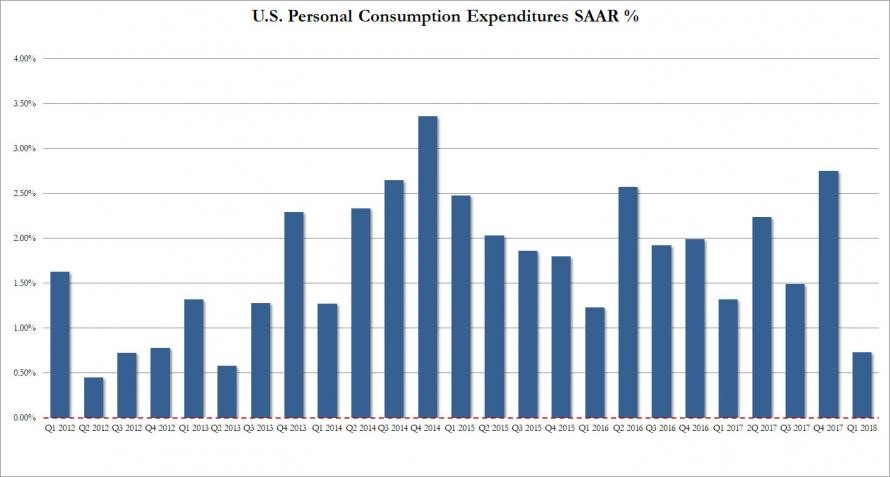
The weakest part of this report is the seasonally adjusted consumption growth rate was only 1.1% which met expectations. As you can see from the chart below, this was the weakest quarter for consumption since Q2 2013. It’s amazing to see growth was weaker than any point in the 2015-2016 slowdown. Throughout this recovery, there have been quarters where each segment has done poorly and quarters where each one has done well. This lack of cohesion partially explains why there hasn’t been quicker growth and also explains why there hasn’t been a recession. It’s the equivalent to a sector rotation without a bear market.
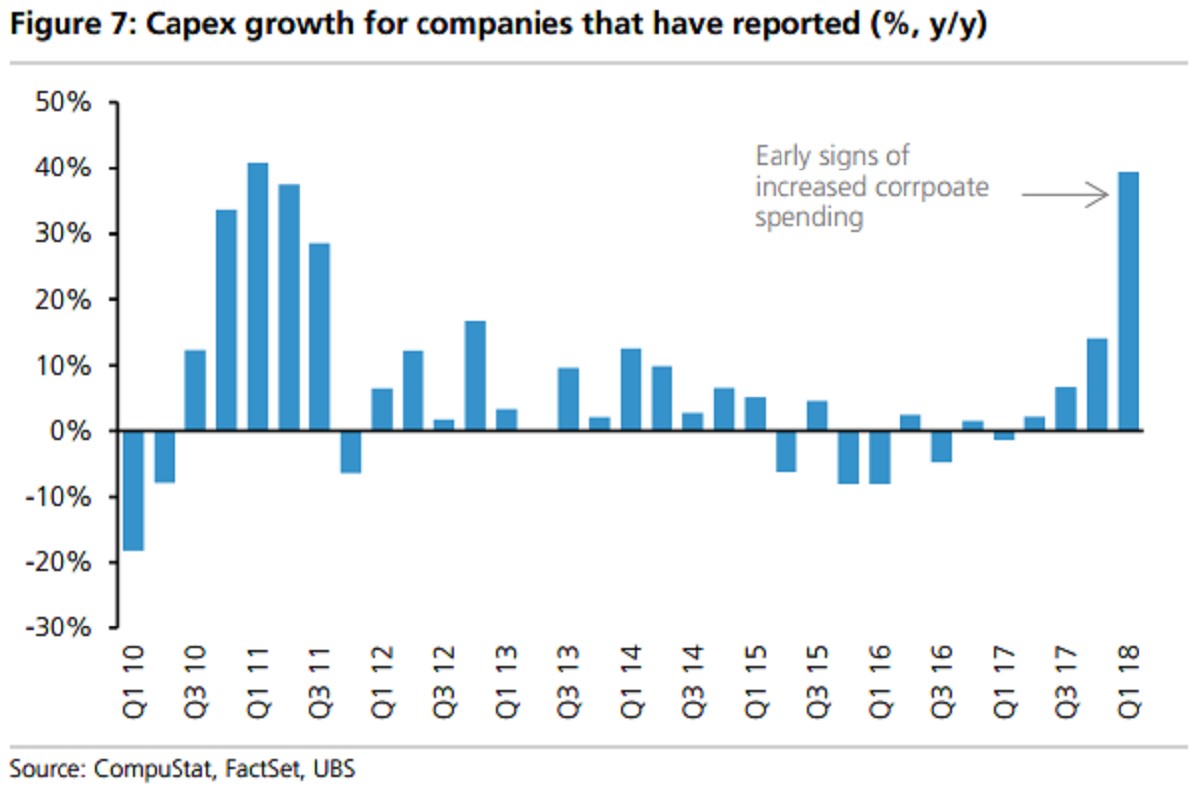
Corporate Pickup In Capex
It’s interesting to see weak fixed investment growth paired with the recent quarterly earnings reports. As you can see from the chart below, from the 130 firms which have reported earnings in Q1, capex increased 39% year over year. That’s the fastest growth rate in 7 years. Net buybacks increased 16% and dividends increased 11%. This data is calculated with the goal of understanding the effect of the tax cuts because opponents of the policy say the money went to buybacks and proponents claim it will boost economic growth. I’m more concerned with the difference between this growth and the fixed investment growth. It’s not as if the small businesses which aren’t in the S&P 500 are skimping on capex. It will be interesting to see if fixed investment is revised higher in the revisions to GDP. Specifically, business spending on equipment was up 4.7% which was much lower than the double digit growth rate in the 2nd half of 2017.
Improvement To Wage Growth
Wage growth is one of the most important stats because it tells us where corporate margins will be and if the Fed will hike rates further. One of the reasons investors have shirked stocks despite great earnings is because they fear a peak in earnings growth brought about by tougher comparisons and weaker margins. One of the recent trends has been that the Atlanta Fed wage growth has been stable while the employment cost index has been showing accelerating growth. The ECI report makes more sense because the labor market is becoming fuller over time. The Atlanta Fed has wage growth peaking at 3.9% in October and November 2016. The March report has it at 3.3%. That’s up 4 tenths from February. I wouldn’t be surprised to see growth hit a new cycle high this year.
The quarter over change in the ECI report for Q1 was expected to be 0.7%. The actual report showed 0.8% growth which is 2 tenths faster than last quarter. This is a sign the Fed should be hiking rates. It also points to a higher than expected PCE reading on Monday. As you can see from the chart below, the year over year growth was 2.7% which was one tenth higher than last quarter.

Fed Meeting Coming
I have been discussing in previous articles how the weak GDP report would dampen the ability of the Fed to raise rates. However, this improvement in the ECI and potentially a beat from the PCE report on Monday could push the Fed in a hawkish direction. The latest Fed fund futures suggest the latter point as there is now a 6.7% chance of a hike in the May meeting which will occur next week. We’re now in the period of the Fed’s hike cycle where a meeting where rates aren’t hiked is more surprising than a hike. For a reason I’m not sure of, the hikes in 2018 are expected to be back end loaded. If the Fed doesn’t hike next week, there will be one hike in the first 5 months. However, the Fed is expected to hike rates 3-4 times this year, meaning 2-3 hikes in the final 7 months. With inflation anticipated to increase, the chance of 4 or more hikes is now at 46.5%.