Stocks Rally Slightly
The S&P 500 was up 0.15% on Tuesday. It’s surprising to see the Nasdaq was up 0.27% since Oracle was down 9.5% on weak guidance and Facebook was down 2.6%. The S&P 500 is almost exactly in the middle of its range. I’ll say the range started on February 9th which was the day after the correction ended. If you look at the 3 month chart, it looks like the S&P 500 made a higher low on March 1st. The market needs to stay above 2,678 to keep that streak intact. Whether there is a higher low depends on the reaction to the Fed meeting on Wednesday.
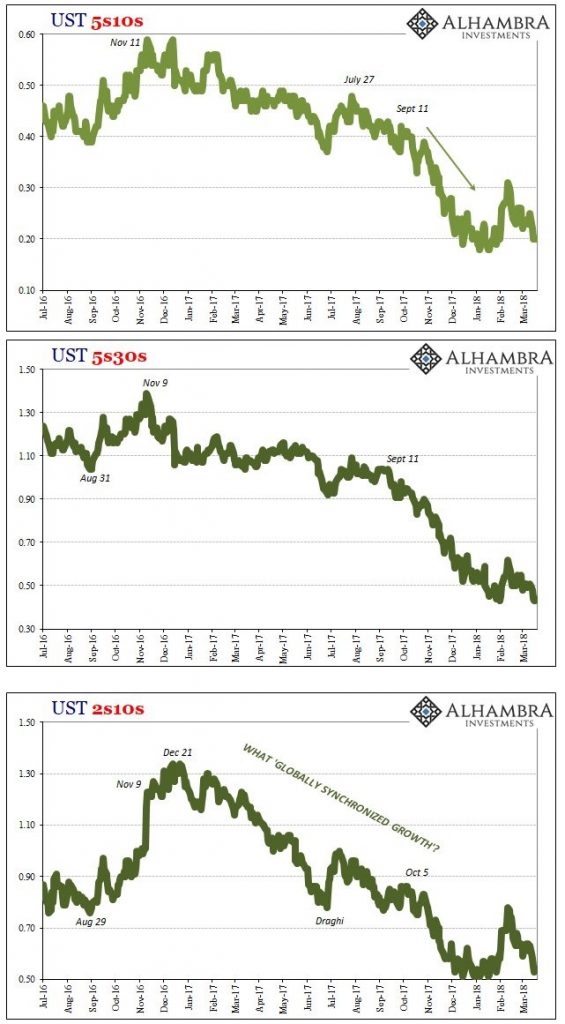
The biggest action in the market on Tuesday was in the bond market. The 10 year yield increased 4 basis points to 2.90%. The 2 year yield increased 3.7 basis points to 2.34% which means the curve steepened slightly. The difference is still 55 basis points. I think the yields rose in anticipation of what the Fed will say on Wednesday. Whatever the Fed says, expect a sharp reaction. I am interested to see if the Fed still doesn’t care about the flattening yield curve.
Previously, the Fed stated it didn’t care about the level it was at because it was normal for that point in the cycle. You can argue that the current yield curve is very steep for this point in the cycle because the economy is in the 2nd longest expansion since 1854. However, the Fed should never want to see a recession if it can prevent it. Inflation is still low and full employment isn’t here, so inverting the yield curve with excessive rate hikes is unnecessary. As you can see from the chart below, each part of the yield curve is near its flattest point of this cycle. So far, my prediction that the yield curve won’t invert in the first half of the year has been correct. It’s easy to call for an inversion soon because it will garner headlines. It’s interesting that a recession in the 2nd half of 2019 is now the consensus. Calling for a recession still generates headlines though because if it bleeds it leads.
Alternative Look At Overbought Stock Market
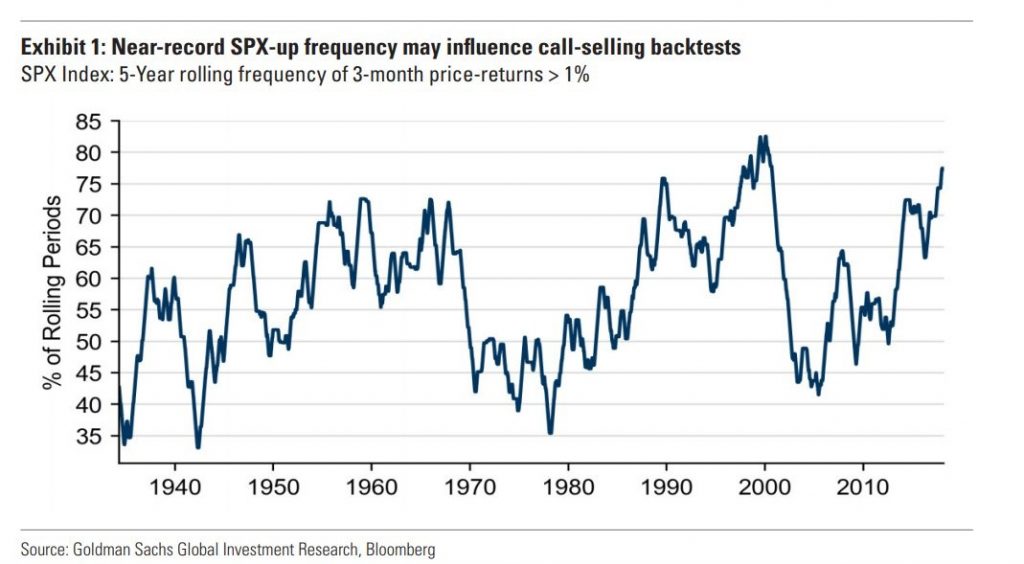
The chart below is an alternative way to show that stocks are overbought. It shows the 5 year rolling percentage of 3 month periods where the S&P 500 is up at least 1%. There are 20 quarters in 5 years, but since the data is rolling, it changes every day. The peak was in 2000 when almost 85% of these periods were up more than 1%. This is because stocks went up in a straight line. If there ever were down days, the market quickly reversed itself. As you can see, the current market has the 2nd highest peak of these rolling periods with greater than 1% returns since at least 1935.
The chart can easily have a reversal in the next few weeks if stocks continue to stay range bound. Currently, the S&P 500 is up 1.21% in the past 3 months, so this index could easily reverse. I wouldn’t say this is signal of an imminent decline since earnings growth is strong and the economy isn’t headed for a recession. Interestingly, the CNN Fear and Greed Index is at a 15 which signals extreme fear. It’s funny because the market is only down about 5% from the all-time high. I would say the stock market is neutral because it’s in the middle of the range.
Fiscal Policy Easy
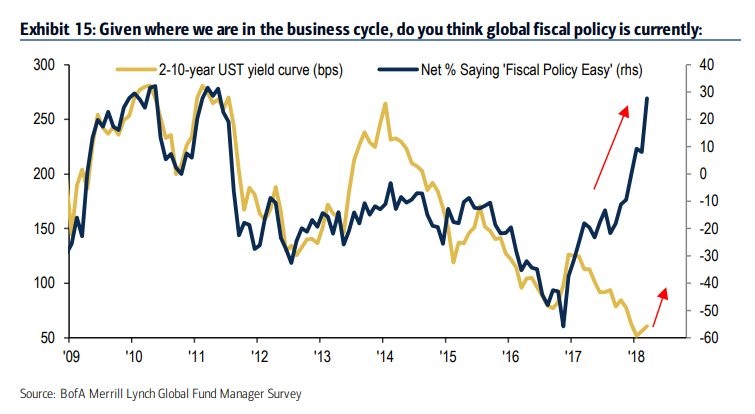
2018 is a big change in government policy as monetary policy will switch from easy to hawkish by the end of the year and fiscal spending has switched to easy because of the tax cuts. The chart below shows a survey of what fund managers think of global fiscal policy. It’s similar to the policy in America as 30% on a net basis say it is easy. This is near where it was at in 2010 and 2011. That was right after President Obama’s stimulus package in 2009. Other countries also did stimulus programs as the economy was exiting a major crisis. At that point, the Fed and other central bankers were very easy; this situation is different because both policies aren’t coordinated. From 2012 to 2016, fiscal policy was neutral and monetary policy was dovish. The chart showing the yield curve with the arrow pointing up is misleading because the yield curve won’t steepen as a result of fiscal stimulus. There will be a few countertrend moments where it steepens, but the trend of flattening will continue until the Fed cuts rates during the next recession which I think will be in 2020 or 2021.
Fund Managers Survey
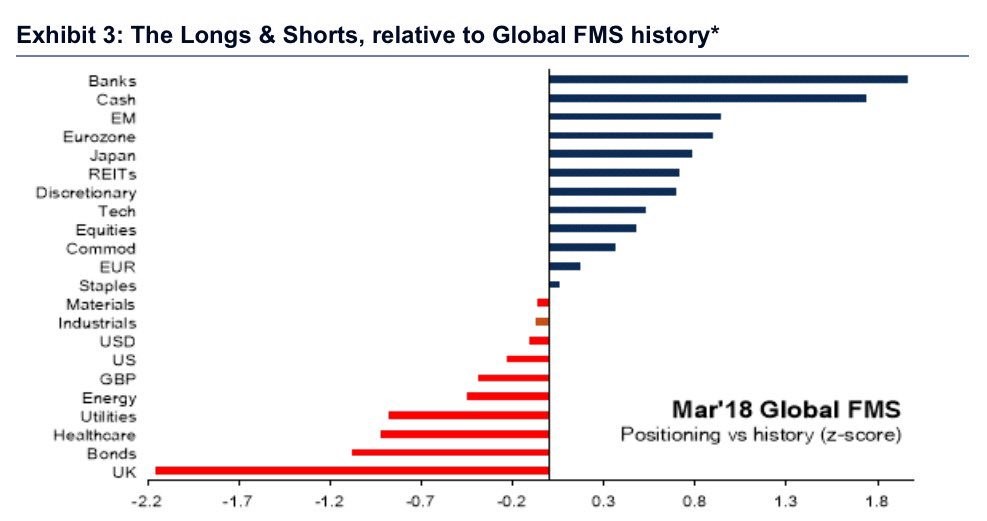
The chart below shows the banks and cash are over owned by fund managers while U.K. stocks are under owned. U.K. stocks have been under owned in many surveys as investors steer clear of the country because of Brexit. It will lose many of its trade agreements once the Brexit is complete. The banks are loved because of the potential deregulation which will occur when Dodd-Frank is partially repealed in the next few weeks. The most surprising asset on this list is cash because the cash position investors collectively have is very low. Maybe because of the uncertainty surrounding the correction in stocks and the tariffs, fund managers are sitting on their hands, waiting to pull the trigger. This could be bullish for stocks as equities are only over owned slightly compared to historical data.
Conclusion
The Wednesday Fed meeting is the most important one in a while because the market is deciding if it will continue the uptrend or stay in a holding pattern. If the Fed acts as expected, uncertainty around what it will do with rates this year will decline. This could cause fund managers to utilize their hefty cash positions by buying stocks. That could help the stock market make new highs in the next few weeks.