10 Year Bond Yield
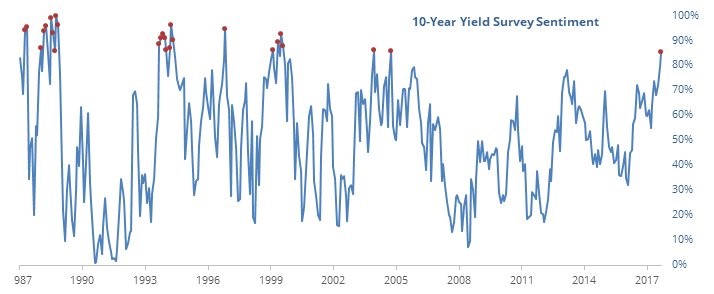
The 10 year bond yield fell about 1 basis point to 2.82% on Thursday. The yield is about 1 basis point above the March first low. I have become increasingly bullish on long term bonds. I am bullish because growth expectations should be coming down in the next few weeks. As you can see from the chart below, being bullish on long term treasuries is an extremely non-consensus trade as the sentiment index shows about 85% of investors think yields will rise. Keep in mind, this sentiment is bullish on yields, but bearish on the bonds. The weak retail sales results in the past 2 months don’t justify the 10 year yield being at 3%. Growth expectations are falling along with inflation estimates. The PPI, CPI, and wage growth in February all signal lower inflation than January. If the Fed follows the data and goes with a dovish hike, it could further signal to the market that the first half of 2018 won’t see the economy run hot.
While the breakeven inflation rate didn’t go gangbusters, it did increase from 1.66% in June 2017 to 2.14% in February 2018. The breakeven rate is only down 7 basis points from the peak as of Wednesday. It still has further to fall as the new theme of slowing growth gains popularity. The tariffs provide a great entry point for the short inflation theme because the consensus thinks tariffs will cause inflation. While significant tariffs could cause prices to go up, it’s not certain if they will be enacted. What’s more certain is the economy is slowing. This doesn’t necessarily mean stocks will correct again since growth will be faster than 2016.
Flows Of U.S. Treasury Purchases
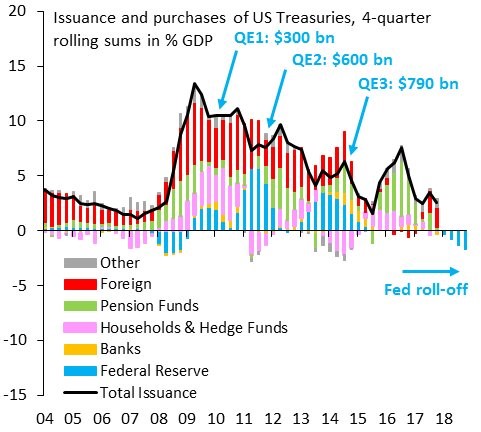
While I’m bullish on long term treasuries, it’s important to show some of the arguments which disagree with me to properly challenge my thesis. The best investors understand exactly how they can be wrong. You don’t want to go into a trade blindfolded. In a debate, you want to know what your opponent will say, so you can take down their argument. If you don’t know their argument, they can take you down. Knowing where you can go wrong, can help you get out of a trade earlier because you can see the factors going against you. The chart below shows the money flow of U.S. treasuries. As you can see, the Fed is selling treasuries. Furthermore, the government will be issuing more debt because the deficit will be going up. My thesis is that when growth falls, causing real rates to fall, treasury yields will fall despite the extra supply.
Still Not Much Cash
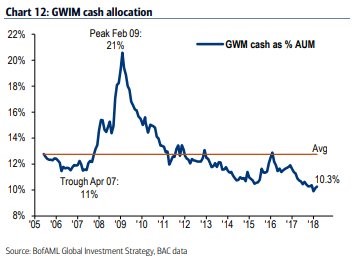
I’ve looked at the sentiment readings in February. While there wasn’t exactly fear in the stock market, the percentage of bulls declined. The sentiment indicators are near term indicators which aren’t reliable unless they’re at extreme levels like January. The main reason I checked the sentiment indicators was to see if the intense bullishness cooled off. Even though they no longer show extreme bullishness, the chart below indicates there wasn’t exactly a tsunami of selling. As you can see from the chart below, the cash as a percentage of assets under management has barely moved up. This makes sense because the stock market is still high and interest rates are still low. This doesn’t mean you should be bearish on stocks, but it does mean the correction wasn’t a big shake out.
Dollar Is Weakening
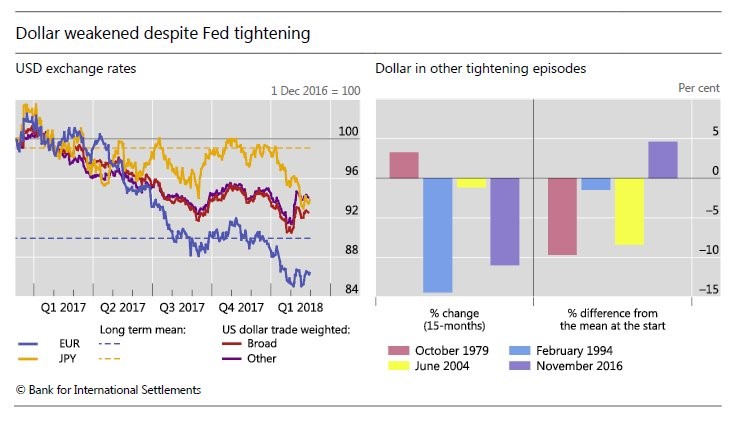
One counterintuitive trend that is occurring is that the dollar is selling off when the Fed is raising rates. You would think that when a country raises rates, it’s currency would increase. However, the dollar is a risk off trade. When the Fed raises rates it usually means the economy is doing well. That’s when the risk off trade does well. The chart on the left shows the recent history of the dollar weakening as rates have been raised and the Fed has started unwinding its balance sheet. The chart on the right shows the historical instances where rates have risen. In most cases, the dollar has fallen. If the dollar continues to fall, it’s great for stocks. Unfortunately, the Fed raising rates isn’t a guarantee that the economy is strong. It’s a good sign, that the Fed is raising rates, but the Fed is only following the market. If the situation turns around because the economy flatlines, then stocks won’t be in a good place and the dollar could rise.
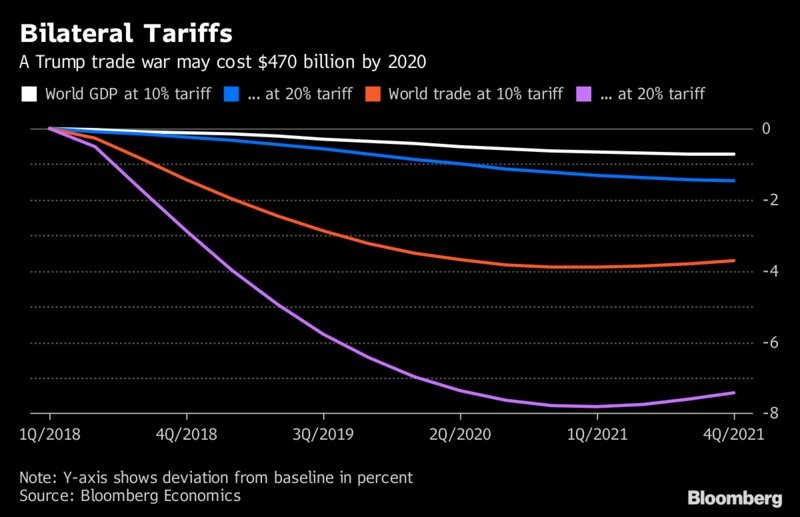
What A Trade War Would Cost
In keeping with my dedication to show why I can be wrong on a trade or an opinion, let’s look at what a trade war would mean for the economy. Just because I don’t think a trade war will occur, doesn’t mean I am not interested in what it could do. When calculating the expected value, you multiply the percentage chance of it occurring by the result of what would happen if it occurs. Therefore, it’s valuable to know what would happen. Predictions are never absolute. I would never say, there’s no chance of a trade war. Rather, I think the chance of a trade war is lower than what the market thinks. With that being said, the chart below shows the cost of various tariffs. If the U.S. puts a 10% tariff on imports and the world retaliates, it would cost 0.5% of global GDP by 2020. That is $470 billion. World trade would fall almost 4%.
Conclusion
I showed why I think the 10 year treasury yield will fall in the next 3 months and showed how I could be wrong. I also showed what would happen if a trade war occurs, in the event I’m wrong in my prediction that one won’t occur. If there’s a 10% chance of a trade war, then the market should price in a 0.05% decline in global GDP and a 0.4% decline in global trade. That’s not much of an impact. The higher the tariffs get, obviously the bigger the problem will be. However, the higher tariffs have a lower probability of occurring.