Amazing ADP Report- Economy Could Run Hot
The labor reports have become more important lately because they help us determine if the economy is running hot. A bad report is usually considered a one-off event. It’s sometimes blamed on the weather; investors expect it to be revised higher. A solid report is the sweet spot because it signals the economy is steady, but extra rate hikes aren’t needed. This is a Goldilocks interpretation where inflation is more feared than a recession. A great report is a bit worrisome because we know it’s not sustainable and can lead to wage growth inflation.
The latest ADP report signals the economy is running hot which could be bad news for stocks. The private payrolls report showed there were 235,000 jobs created. This beat the expectation for 205,000 jobs created. Last month’s report was revised 10,000 higher to 244,000. This is the 4th straight month the report showed job growth of at least 200,000.
The labor market report on Friday is expected to show 222,000 jobs created and for the unemployment rate to fall from 4.1% to 4%. The BLS report is taken more seriously than the ADP report which means we are potentially getting an advanced reading of how stocks will react on Friday. We could see inflation estimates increase. The ‘running hot’ trade could come back in style which means utilities decline and tech rallies. It all depends on how the results come in versus expectations.
Mid-sized businesses added the most jobs as they hired 97,000 people. Small firms added 68,000 jobs and large firms added 70,000 jobs. The small firms have been claiming they are desperate to hire workers, but we haven’t seen a bump up in their job creation. That’s probably a good thing because if they were to hire more workers, the labor market would fill up quicker. While I don’t expect a completely filled labor market until mid-2019, that projection will be moved closer if the labor market adds more jobs than I expect.
There Are Only A Few Counties With A High Unemployment Rate
The goods producing sector added 37,000 jobs and the service sector added 198,000 jobs. Anyone worrying about the manufacturing job losses due to outsourcing hasn’t checked the data in the past 10 years. Services add the most jobs. They have replaced the old sectors. There is no need to add tariffs to get jobs back. The unemployment rate in Ohio in December was 4.7% on a seasonal adjusted basis. Not seasonally adjusted, there a few counties with a high rate. Noble has an 8.1% unemployment rate and Monroe has an 8.8% unemployment rate. It’s a sign of the times that I need to look at individual counties to find high unemployment rates. The steel and aluminum tariffs certainly will help these areas.
With such a large country, there’s no way to have every state and county running at full employment with great wage growth. If the Fed gets too fine with this fear of not having enough wage growth, it could cause unintended consequences. There are many problems larger than weak job creation in the steel and aluminum industries. These weak counties are the equivalent of a pimple, while a recession or high inflation for the whole country would be like the flu.
To be clear, I don’t think the Fed is making this mistake since it will probably have raised rates 8 times by the end of this year. The bigger worry is fiscal policy as stimulus level spending and tax cuts have occurred near the end of the recovery. I get that every politician wants to boost the economy, but I fear a power washer is being used to water a delicate flower.
Natural resources and mining added only 2,000 jobs, while ‘professional and business’ added 46,000 jobs. The only category that added less jobs than mining and natural resources was information technology which lost 1,000 jobs.
TIPS Suggest Incoming Inflation
The yield curve is more important than the TIPS breakeven curve because bond yields are affected by real yields while the TIPS breakeven curve is about inflation expectations. The real yields tell us where growth is expected to be. Inflation has had sharp turns throughout this recovery, so changes don’t signal much. For example, growth improved in 2017 while inflation fell. If real growth is expected to tumble, that would be a problem. That being said, the chart below is interesting because it shows 1 year inflation estimates are much higher than the longer term estimates. The rest of the term structure is flat.
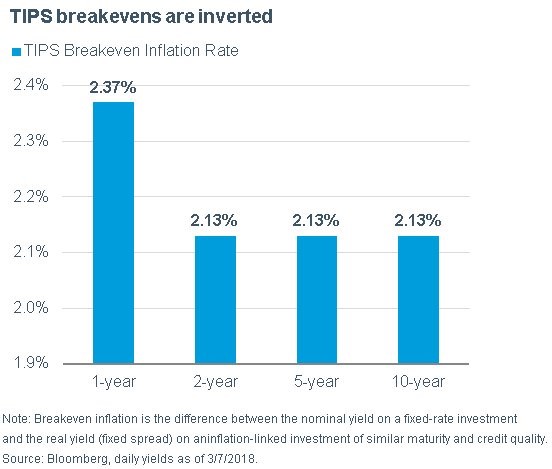
I expect inflation in the next 2 years to be much higher than inflation in the next 5-10 years because the labor market will be tight and the demand for commodities will be high. After the recession in the next few years, these inflation pressures will be alleviated. I wouldn’t conclude a recession is coming just because of this TIPS breakeven inversion.
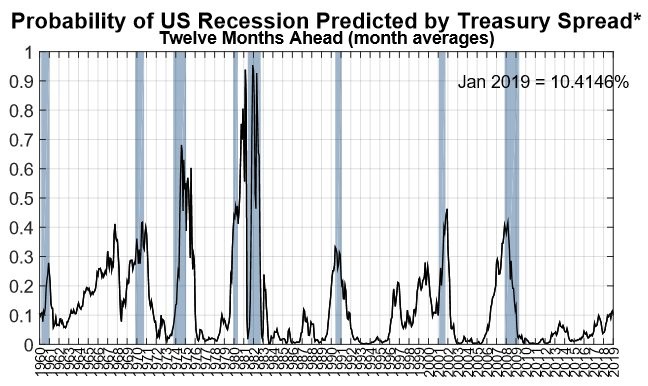
The difference between the 10 year and 2 year bond is 63 basis points. I’ve seen some analysts claim this a warning zone. That’s an incorrect assertion. The warning zone is the inversion, since the recession starts after that. As you can see from the chart below, the treasury spread implies there’s a 10% chance of a recession. The chart I showed in a previous article, which had the recession chance above 30% based on valuations and the yield curve, was forecasting a recession mostly based on valuations. While there’s nothing wrong with that, it’s weird to use stocks to forecast a recession when you’re trying to forecast a recession to decide what you should do with your stock portfolio.
Conclusion
The economy is running hot based on that ADP report. Let’s see if the BLS report on Friday confirms that result. It will be interesting to see the latest jobs report’s effect on the underemployment rate and the employment population ratio. Those are two of my favorite indicators now that the unemployment rate and the jobless claims don’t appear to be working. If you followed those two indicators, you would have expected wage accelerated wage growth equivalent to a cycle peak last year. Instead I think it will occur next year.