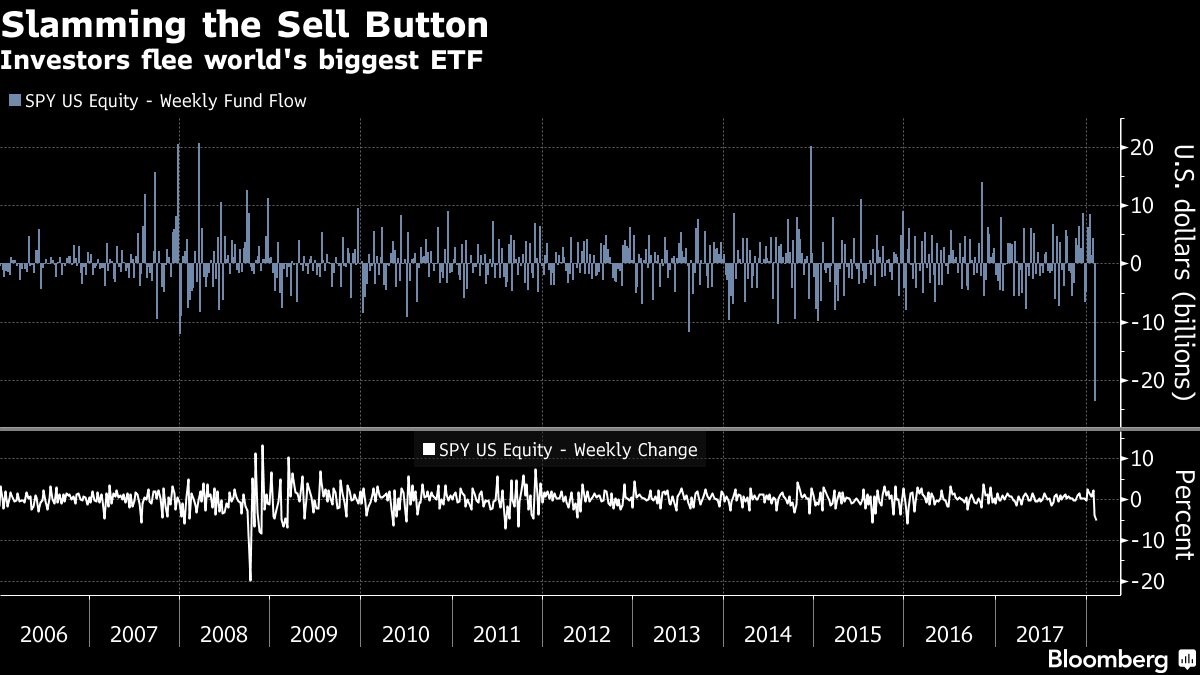
Record ETF Selling Last Week
As you can see from the top chart below, there was record S&P 500 ETF selling last week. Obviously, that’s an incomplete statistic because total ETF holding are much larger now than in 2008 during the financial crisis. The bottom chart tells the whole story as the percentage of total selling was much less than in late 2008. The selling was similar to the corrections in the summer of 2015 and the winter of 2016.
It’s important to point out that if you are trying to follow a passive strategy, you shouldn’t ever sell unless you need the money. I’m not saying that a passive strategy is better than an active strategy. That depends on how much skill you have. I’m saying that if you decide to be a passive investor, you shouldn’t be selling during corrections. That will be disastrous for your returns. If you are squeamish about losing money, you should adjust your diversification so that you are taking less risk. The best change to make would be to invest the new money you save into bonds, rather than selling your stocks. You lower the percentage of risky assets without selling them to avoid timing the market.
Stocks Rebound On Monday
Even though the 10 year bond yield remained at a 4 year high at 2.8548%, stocks rallied. This is consistent with my thesis that the higher yields would cause a volatility shock and maybe multiple compression, but not a bear market because earnings are growing too quickly. The short volatility trade has been great in the past two days as the SVXY is up 18% and the XIV is up 5%. The XIV was probably up less because it’s being closed by Credit Suisse. The VIX was down 9.6% to $26.27.
The S&P 500 was up 1.39% and the Dow was up 2.09%. It was a broad based rally as every sector was up. The materials and technology sectors did the best as they were up 2.09% and 1.79% respectively. Apple and Amazon had huge days as they were up 4.03% and 3.48%. Amazon was one of the stocks which got caught up in the selloff even though it had a great quarter. The stock was down 7.67% at the closing low even though it blew past earnings estimates. The stock still has a triple digit PE multiple, but that might change as AWS continues to grow. The company recently shuffled the deck to improve profitability as it fired a few hundred employees at its Seattle headquarters while hiring heavily in the Alexa and AWS business units.
Yield Curve Steepens More
The yield curve steepened even more on Monday as the difference between the 10 year and 2 year yield widened to 78 basis points. This is a sharp widening of 28 basis points since January 4th. The last major counter trend steepening was when the difference increased from 76 basis points to 134 basis points from August 2016 to December 2016. The higher it goes, the lower the chance of a recession in 2019 gets.
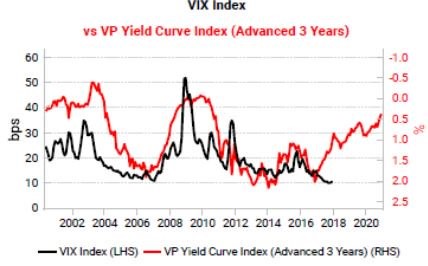
Many of the trends in asset prices we discussed when the yield curve is near an inversion, no longer apply because of this steepening. I still expect it to invert by the first half of next year. The chart below aims to use the yield curve to predict increases in volatility. If you extrapolate the previous trends on future results, the current yield curve is projecting the VIX to increase in the next couple years. However, this relationship might not work this cycle because it will probably take longer than unusual to go from a 10 year-2 year spread of 50 basis points to an inversion judging based on the curve’s action this cycle.
Morgan Stanley Says Cycle Is Almost Over
Many of the major investment banks are predicting a recession in the next few years. Guggenheim is predicting a recession in either late 2019 or mid-2020. That would make this the longest expansion since 1854. This forecast, which was made 3 months ago, is based on the yield curve. Clearly, the recent steepening throws a wrench into that forecast.
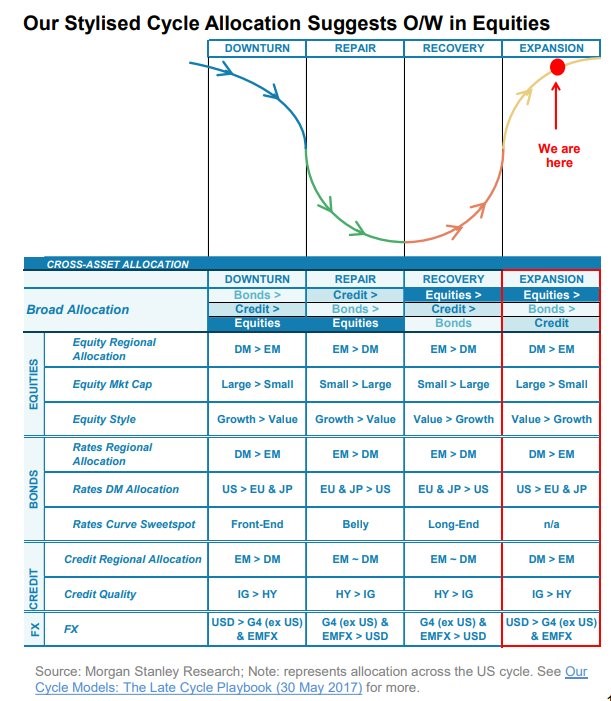
The table below shows where Morgan Stanley thinks the expansion is at. As you can see, they think the economy is about 75% through the upward part of the cycle. It says that equities should be the largest allocation at this stage which makes sense. It says developed markets should be held over emerging markets. I disagree with this point because the emerging markets are at a different point in their cycle. They are in the recovery stage after underperforming for years. Another interesting point is it says to own the U.S. dollar. The dollar index fell today as it was down 0.25% to $90.15. This makes sense because the trend reversals seem to be over.
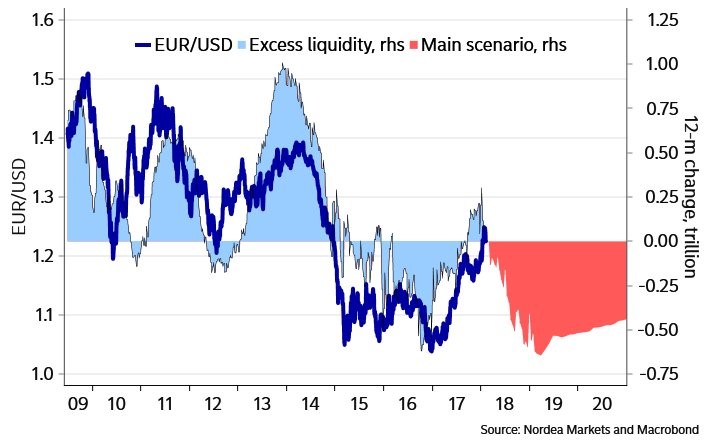
Dollar Strength Coming?
You can either say the weak dollar has been driving emerging market economies higher or that emerging markets are driving the dollar down. They are inversely correlated. Their expected relationship stayed the same, but neither are acting as if the cycle is almost over. As you can see from the chart below, that might change in the next few months. The main scenario shows the 12 month change in liquidity means the dollar will rally to near parity with the euro. This might hold back the emerging economies even though they have gained momentum.
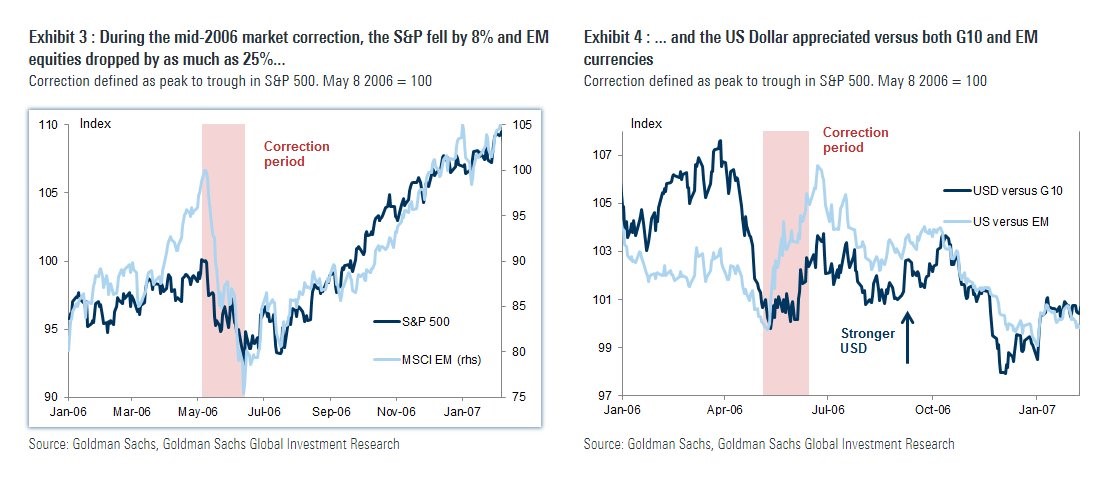
The charts below show an example of when the dollar appreciated at the end of the last cycle. As you can see, the dollar went up versus the emerging market and G10 currencies. This led to the S&P 500 falling 8% and the emerging market equities to fall 25%. To me, it looks like the recent correction was driven by rates as the dollar rallied in sympathy of the action. Even though everyone is focused on interest rates, I think a prolonged dollar rally could have more of a negative impact on risk assets.