Almost Every Streak In The Book Broken
On Thursday, stocks went from a gain to a loss as some investors wondered if the market would finally fall. Alas, the market righted the ship and it closed about flat. The biggest down days we’ve seen are when the market gives back some of its gains, but finishes close to even. The market has not had a substantial decline in the past few quarters. As I said, this is the Wayne Gretzky of stock markets because he owns almost every hockey record and this bull market owns many records.
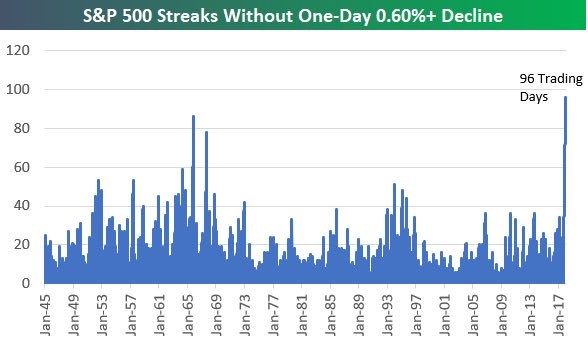
One more record you can add is the streak without one day being down 0.6% or more. As you can see from the chart below, going back to 1945, the current streak of 96 trading days without a 0.6% decline or more is by far the longest. One streak the current market doesn’t yet have is the record for trading days without a 1% decline. The current streak is 108 days. The longest streak lasted 184 days in 1963. There wasn’t a sharp decline after that one ended, so it’s not a given that the end of this streak means disaster.
Tax Cut Effect
Most analysts and investors are still trying to figure out the effect of the tax cut. We’ll start to see how the tax cut boosted the overall economy in the next couple months when more data points come out. The optimists say the tax cut will put more money in the hands of the consumer and the overseas capital will be repatriated into the American economy, creating new jobs and boosting wages. The pessimists worry about the state and local taxes which won’t count as a deduction against federal taxes. I think these states will lower their taxes in the next few years to stay competitive, thus mitigating that negative effect. The pessimists also worry about the corporate windfall being spent on buybacks. To me, this isn’t an issue because the money still flows through the economy.
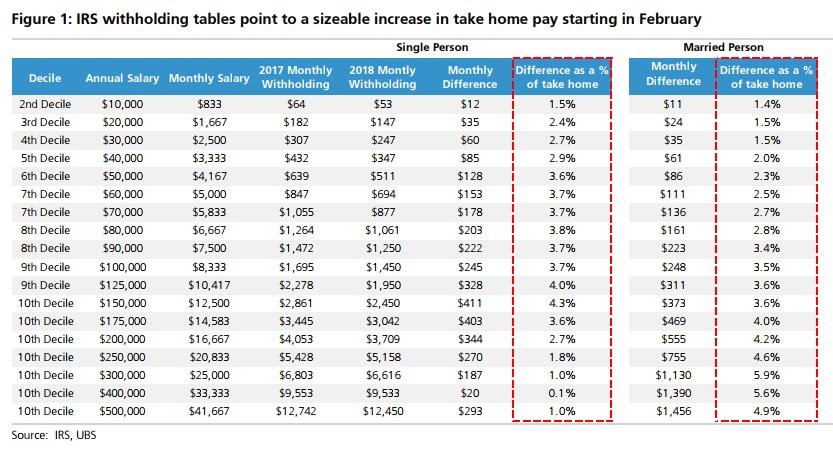
The table below shows the difference in take home pay people in each income category will see starting in February. As you can see, each category has a benefit. While those making $10,000 only see a $12 monthly improvement, that’s a big deal for low income earners. When you look at the top income earners, those who are married have a much bigger benefit than those who are single. The stocks to buy on this improvement in married wealthy families’ income could be the furniture names such as Ethan Allan, Wayfair, and Restoration Hardware.
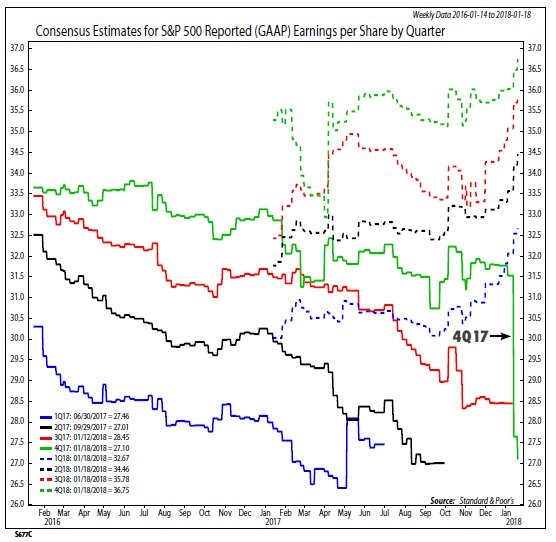
The chart below reinforces the point I have made in previous articles. As you can see, the 4th quarter earnings have fallen dramatically while the future estimates have all risen. There has been $40 billion in write-offs this quarter and it’s not even close to being over yet. Investors don’t care because they’re focused on future results.
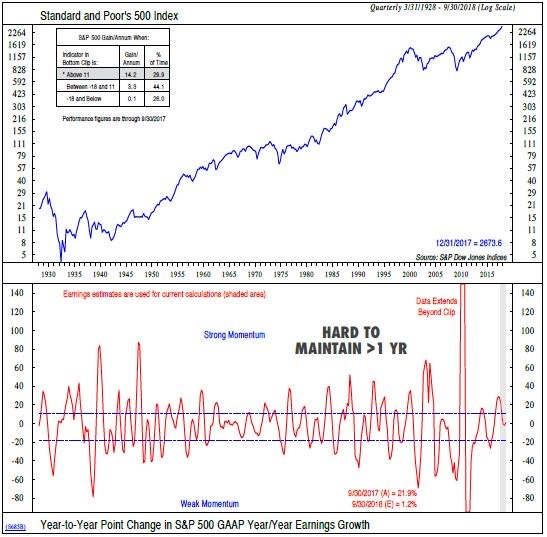
The chart below shows how the S&P 500’s performance is altered by earnings growth. Since 1928 when earnings growth is above 11%, the S&P 500 is up 14.2% per year. It’s up 3.3% per year when earnings growth is in between -18% and 11% and it’s up 0.1% per year when earnings growth is below -18%. That’s good news for this year as earnings growth is expected to be 14%. I expect the earnings estimates to continue to move up for the next 2 months before starting to gradually move lower as they usually do. As you can see from the 2nd chart, it has historically been tough to maintain a high growth rate for more than 1 year, making the estimates for 2019 seem suspect.
The goal of the tax cuts is to have companies improve their capital investment. The chart below shows the historical growth in capex and research and development spending as a percentage of cash flow from operations. As you can see, the percentage invested in capex and R&D has been below the long term average for almost this entire business cycle. The percentage peaked in late 2015 like normally occurs in recessions, but it didn’t lead to anything. Anecdotally we see headlines of firms giving out extra bonuses, investing in their business, and repatriating capital, but I’m not sure if companies are trying to gain positive publicity or if this is a sign of a new round of growth investment starting.

Central Banks Ending QE This Year
The end of QE is going as perfectly as it possibly can. The economy is doing well and risk assets are soaring. Those who believed in the narrative that the stock market has only been held up by central bankers have been proven wrong. It has been painful to be negative on stocks because of the unwind. As you can see from the chart below, this month the QE expansion took a sharp deceleration because the Fed doubled its unwind and the ECB cut its QE in half. The final shoes to drop would be the BOJ announcing an end to its QE and the ECB starting an unwind like the Fed.
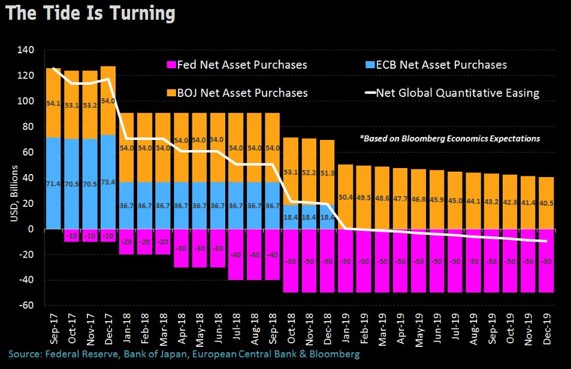
According to current plans, the balance sheets of the 3 major central banks will start shrinking in the summer of 2019. That year could be tough if this unwind matters because the Fed will have a contractionary policy, the tax cut effects will be wearing off, and the U.S. expansion will break the record for the longest ever. The old Wall Street adage that bear markets don’t die of old age and that recessions don’t occur because we’re due will be tested. On the one hand, there needs to be a catalyst to cause a recession and a correction. On the other hand, there is a connection with time and business cycle because usually debt builds up to the point where it gets too risky and then a deleveraging occurs. When the expansion record is near, some will claim other economies have lasted longer without a recession. While that’s true, this is still an unusual occurrence for America because all economies are different.