Dollar Is Crashing?
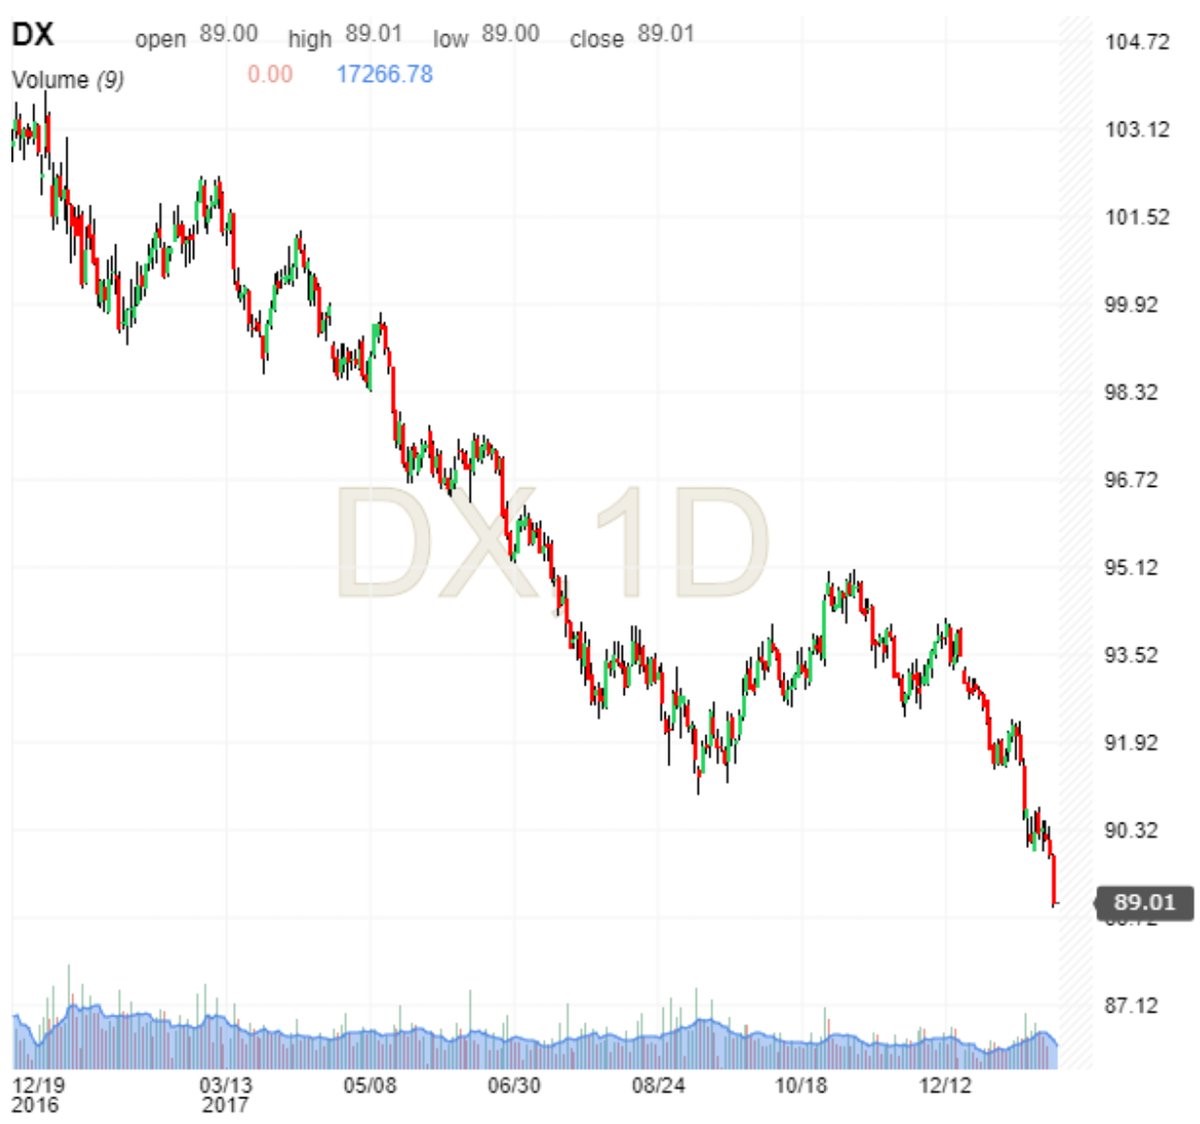
Manufacturing is being helped by the declining dollar. As you can see from the chart below, the dollar has been in a one way path downwards. The DXY hit a 37 month low as it’s down against every major currency in the past year. The daily sentiment index for the dollar is at 14%, meaning investors are extremely pessimistic. This may have been President Trump’s plan ever since he mentioned that the dollar was too high for America to compete on the campaign trail. At Davos, Treasury Secretary Steve Mnuchin’s statement that the dollar weakness isn’t a concern sent the DXY down 0.95% on Wednesday.
The global central banks catching up to the Fed’s hawkishness helps push the dollar down as the ECB is going to end its bond buying by the end of the year and will start raising rates next year. The decline in the dollar has been working in tandem with the increase in oil prices. On Wednesday the price of oil was up 2.33% to $65.96 which is another 3 year high. The rally in stocks, the rally in oil, and the decline in the dollar are 3 of the most overextended price movements.
The chart below shows the Merrill Lynch fund managers’ survey which asks managers which is the most overcrowded trade. As you can see, the fund mangers have a great track record with predicting the direction of the dollar. Both times the long dollar trade was said to be overextended, the USD fell. It’s interesting to see how the short dollar trade isn’t considered to be the most crowded trade. The issue might be that so many trades are overextended as many assets have been moving in one direction since the election.

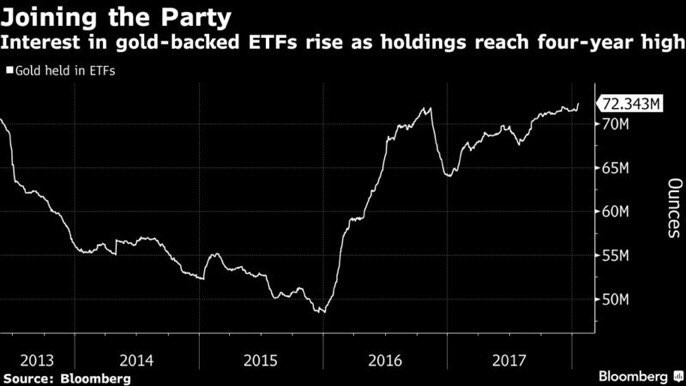
Gold has joined the party which makes sense since the dollar is down and commodities are up. The CRB commodities ETF was up 1.3% on Wednesday and is up 2.58% year to date, signaling inflation will pick up. The breakeven inflation rate is at 2.06%. As you can see from the chart below, the weak dollar policy has helped the interest in gold ETFs reach the highest point in 4 years. Gold was up 1.72% on Wednesday and is up 6.71% in the past 6 months. Gold had a rough Q4 2016 but remains in the uptrend that started in early 2016.
Let’s now look at what the declining dollar does to liquidity. As you can see, the dollar weakness causes the financial conditions to be less tight. It pushed the financial conditions index up 75 points when it was strong in early 2017. This chart was updated on December 7th, so I’d expect the latest action to show it not pushing up the index at all. The increasing equity prices and tightening spreads more than offset the effect of rising rates. The issue is that rates can affect equities and spreads. So far, the markets have ignored the Fed’s rate hikes, but that won’t last for long as the Fed’s policy will probably switch to hawkish in 2019 if the decisions act in tune with the forward guidance.

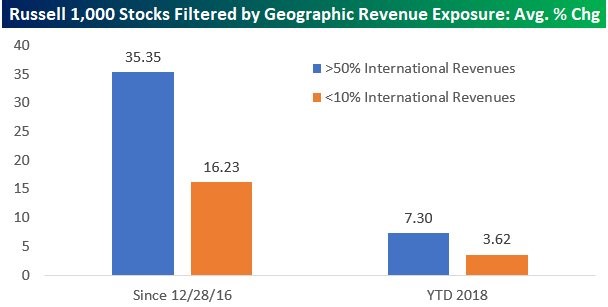
Because the S&P 500 is so heavily weighted with firms which have high international exposure, it is effectively a short dollar trade. Buying the technology stocks is the best way to follow through on this trade because the sector has a high international exposure. As you can see from the chart below, the weak dollar and strong growth internationally have allowed the firms with over 50% of revenues coming from international markets to more than double the performance of stocks with less than 10% international exposure. This the ratio has continued this year. All the trades we’ve mentioned this year have become intertwined. Even though the sell off in the dollar is overextended, it will probably continue if the central banks stay on their course, the economy stays the course, and the President keeps up with supporting a weak dollar. The latter variable is the most certain as Steve Mnuchin said a weak dollar is good for the U.S.
Euphoria Means You Should Buy Stocks?
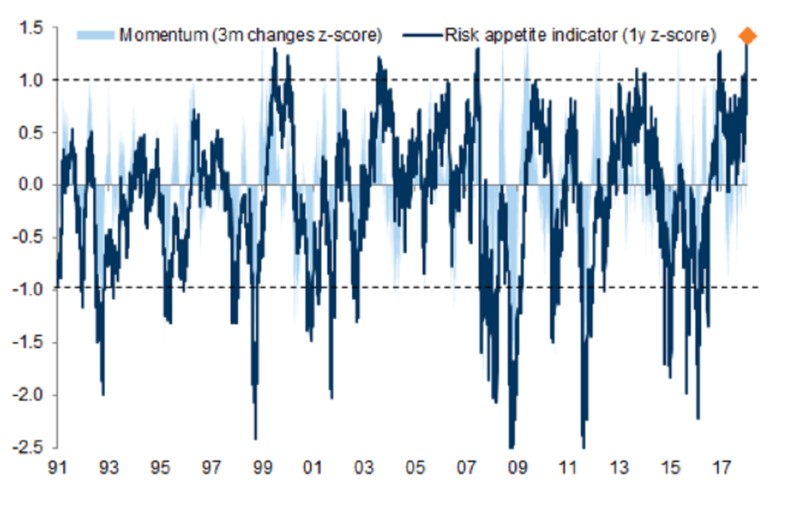
Getting back to the point about how the stock market is still in a euphoric stage, the 1 year z-score for investor risk appetite is at the highest point on record. This stat goes back until 1991, so investors are more enthusiastic now than they were in the late 1990s. The 3 month change in the z score for momentum stocks also shows euphoria is high.
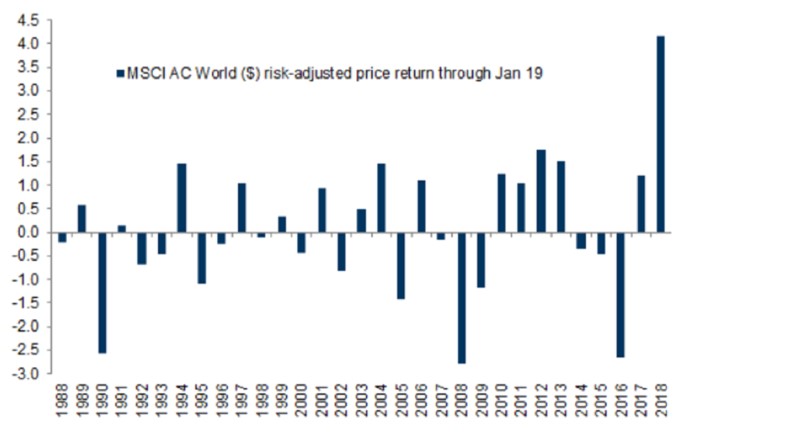
Global equities have added $4 trillion in investments this year. As you can see from the chart below, the risk adjusted returns for global stocks from the start of the year to January 19th has been the best since at least 1988. As I mentioned in a previous article, the 10 year bond has had the worst risk adjusted return to start a year on record. The yield is up 10.02% year to date. It is currently at 2.6465% which is the highest yield since April 2014. The reflation trade is firing on all cylinders which makes 2018 likely the start of the end of the business cycle. The amazing part about these two charts which were created by Goldman Sachs is that Goldman is overweight stocks and underweight bonds for the next 3-12 months. Even with the knowledge that stocks are overbought, investors are maintaining their confidence in the trade to go long risk assets.
Conclusion
There are a few news events in the next week which can change the direction of these trades. The next Fed meeting is in 7 days, the ECB is meeting tomorrow, and the GDP report is coming out Friday. Of the 3, I think the ECB meeting has the highest chance of moving markets. The GDP report is the advanced report, so if it is a surprise, investors can say it will be revised in the direction they expected. I see very little chance of Yellen shocking investors by raising rates at her final meeting.