Economic Growth Weakening?
The term ‘global synchronized growth’ has become a buzzword in the financial press in the past few months. Obviously, just because it is widely used doesn’t make it wrong; in fact, it has been an accurate portrayal of reality. However, it’s always important to question the mainstream opinion. We often see trend extrapolation in economic and financial forecasts. That’s when forecasters simply expect the recent results to continue. That’s a terrible way to do research because of the business cycle. In this cycle, there have been a few fits and starts to growth, making trend extrapolators wrong almost every year.
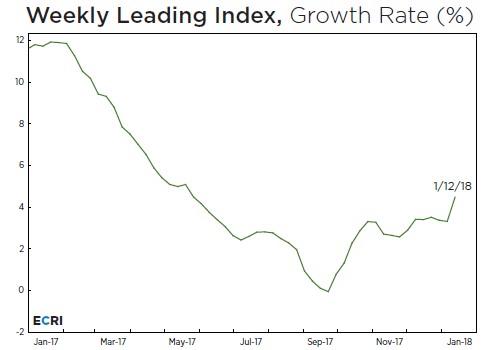
One of the contrarian economic forecasts was the ECRI weekly leading index. As you can see, the index fell from about 12% growth in early 2017 to about 0% growth in Q3 2017. The ECRI did a great job of capturing the quick GDP growth rate in Q2 and Q3. Economic growth is also expected to be solid in Q4. If the indicator works again, the first half of 2018 will see a cyclical slowdown. As you can see, the indicator has moved up again since then signaling the 2nd half of 2018 will see a rebound. If the first half of 2018 is as weak as this indicator suggests, it will be a big shock to the market because almost everyone is on board with the global synchronized growth story.
Empire State & Philly Fed Indexes Confirm Weakness
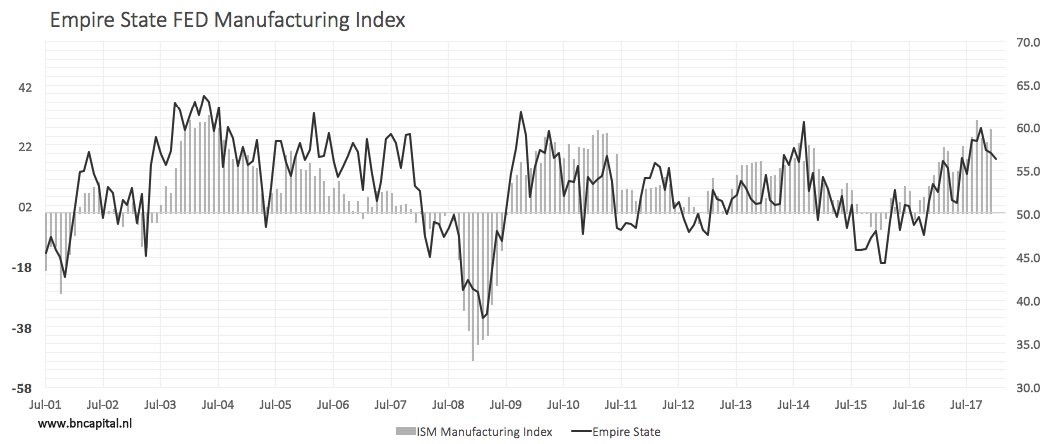
While stocks are rallying on improvements to earnings forecasts and the ending of the government shutdown, there is some economic weakness creeping in which supports the ECRI forecast from 5 months ago. As you can see from the chart below, the Empire State Manufacturing index has been decelerating recently. It indicates the manufacturing ISM for January might be weak. The general business conditions index fell from 19.6 to 17.7. It was more of a stabilization, than outright weakness because the percentage saying conditions improved was down 5.2% and the percentage saying conditions worsened was down 3.3%. The new orders index fell 7.1 points and the inventories index increased 12.4 points. That’s a toxic combination for profit margins. Prices paid and prices received were up 6.5 and 10.1 points respectively, signaling inflation is picking up. On the bright side, the expectations index 6 months ahead for general business conditions and new orders were up 2.3 and 4.9 points respectively.
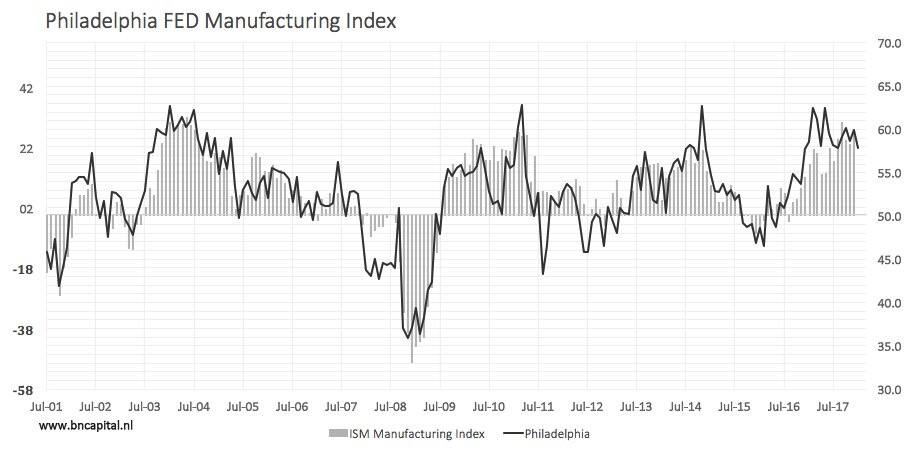
The Philly Fed index is also showing weakness which might be expressed in the next ISM manufacturing report which will be released on Thursday, February 1st. The Philly Fed general business activity diffusion index fell from 27.9 to 22.2. The new orders index fell even worse than the Empire State index as it was down 18.1 points to 10.1. The inventory index was up 10.5 points. The price paid and prices received indexes were up 5.1 and 12. 5 points respectively. Unlike the Empire State index, future expectations were also weak as the general business activity and new orders indexes were down 10.5 and 12.8 points respectively. On the bright side, these results are only showing activity going from great to good. 69.5% of firms expect total production to be up in Q1 2018 as compared to Q4 2017.
The weakness in these two reports and the ECRI index in Q3 2017 aren’t enough to say a cyclical slowdown is afoot. We’ll need to see confirmation from the industrial production report and the manufacturing PMI. That being said, stocks might sell off immediately after those reports if they are weak which means selling now might be the only opportunity to lock in your profits at the high. Keep in mind, we’re discussing trying to avoid a potential 10% correction, not a bear market because nothing indicates a recession will occur in 2018.
The Momentum In Risk Assets Is Ridiculous
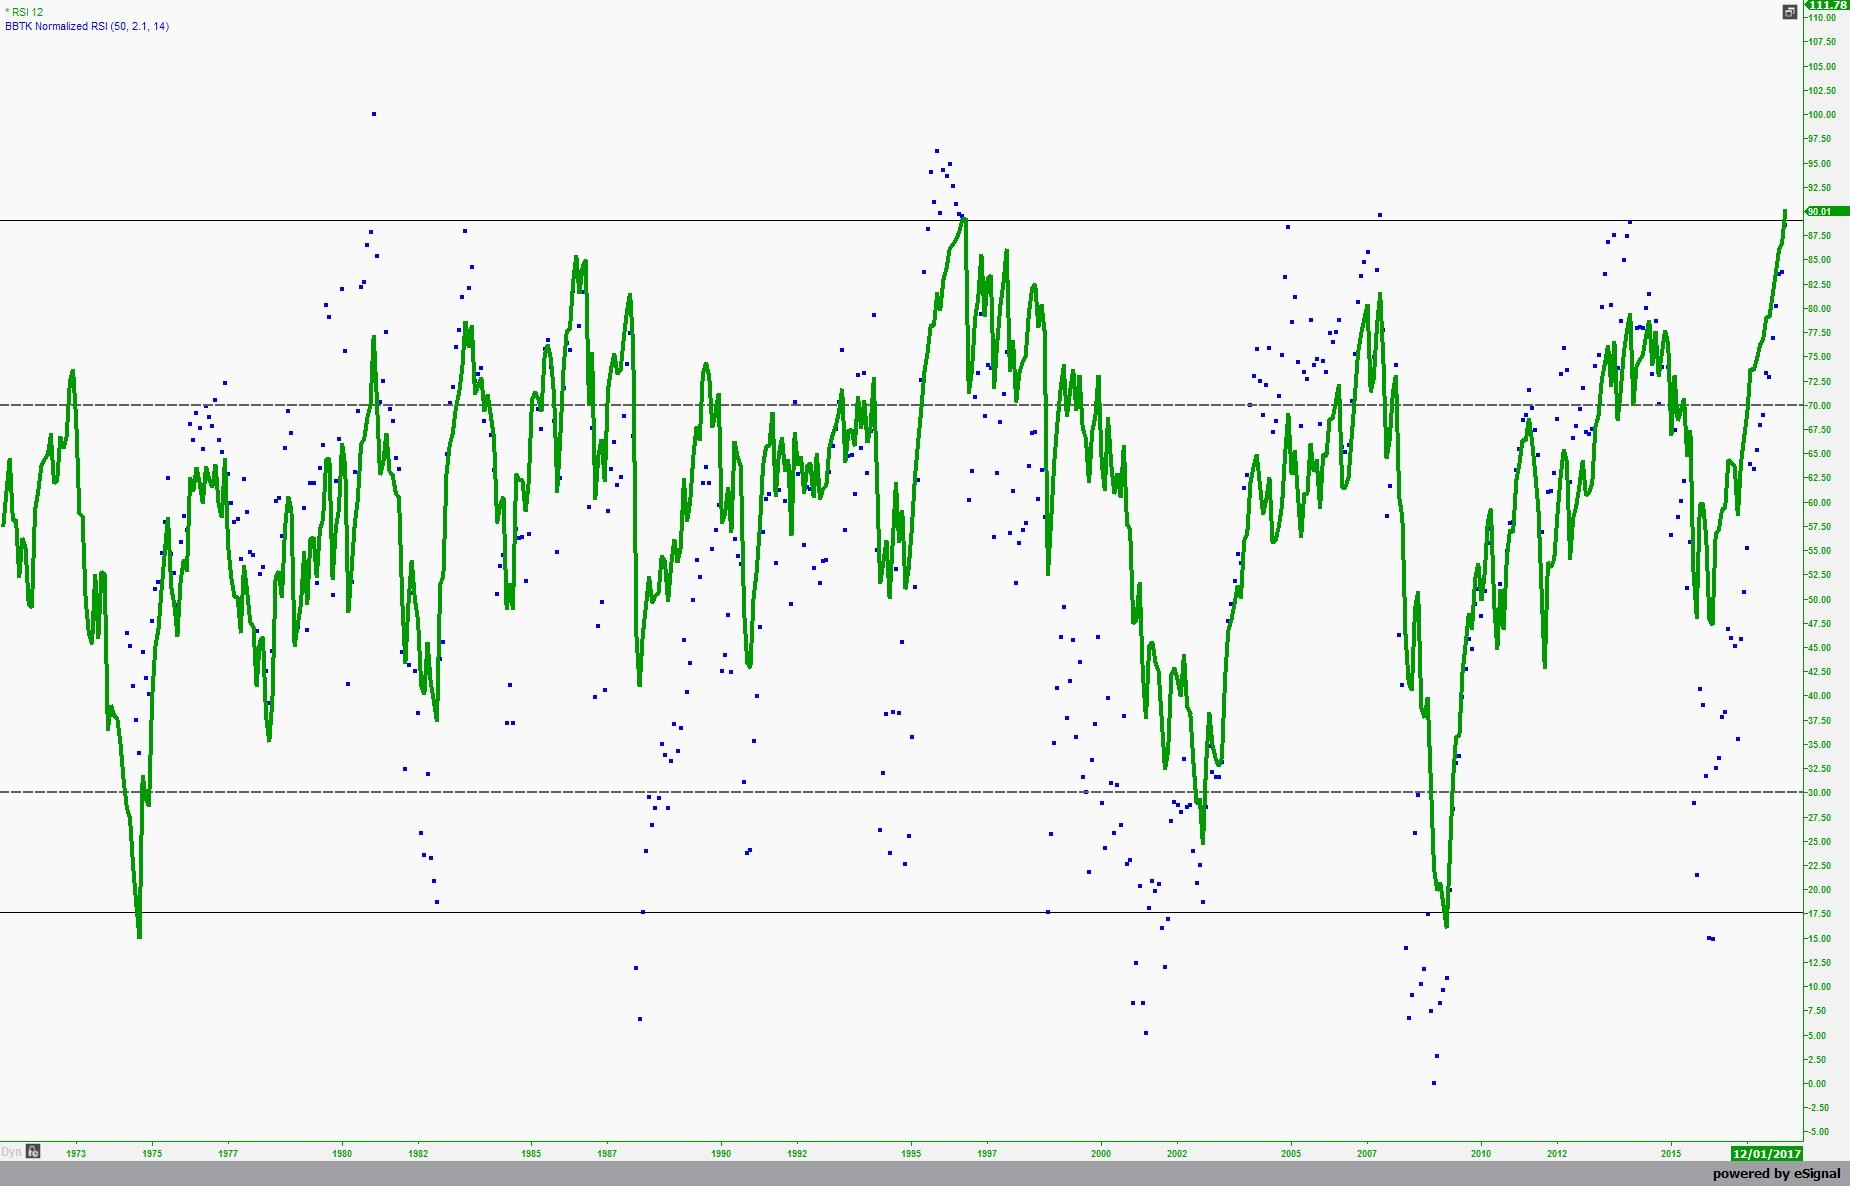
While stocks have been riding high ever since the 2016 presidential election, the momentum in stocks has only recently gone to the stratosphere. As you can see from the chart below, the monthly RSI is at 90.01. That’s the highest since at least 1972. The S&P 500 is already up 5.96% for the year even though the first month isn’t even over yet. Those E*Trade investors expecting 15% returns in Q1 will end up being correct if this pace continues. The S&P 500 is now within 2.5% of the average Wall Street strategist’s year end price target. The two reasons for that amazing stat are that the estimates were too conservative because they didn’t factor in the tax cut and because stocks are overbought. Since the full effect of the tax cut isn’t in the analysts’ earnings estimates yet, I don’t think strategists fully grasped the effect of the tax cut last month. I’m not sure when each one made their prediction, but some might have been made before the tax cut passed. With earnings expected to increase 14% in 2018, any estimate for yearly returns which is in the single digits implies a sharp reduction in the market’s multiple. Instead, the market appears to want to pay a higher multiple on the boosted results.
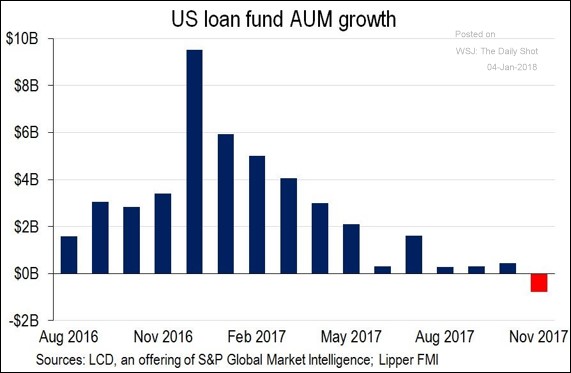
As if you needed more examples of why the market is overbought, the S&P 500 levered loan index has hit an all-time closing high 30 days in a row. As you can see from the chart below, the index has done almost nothing but go up since the election, just like the stock market.
Conclusion
I painted a negative picture in this article because the risk factors need to be reinforced as the S&P 500 has had a good year in just 3 weeks. With stocks doing so well, there doesn’t need to be fundamental justification for a 3% sell off. It’s supposed to be a natural occurrence. I still believe the stock market can fall even though returns are about to be up 15 straight months. While the market doesn’t need a reason to sell off, it has a reason as the Philly Fed and the Empire State indexes show economic growth might be slowing down especially in the manufacturing sector.