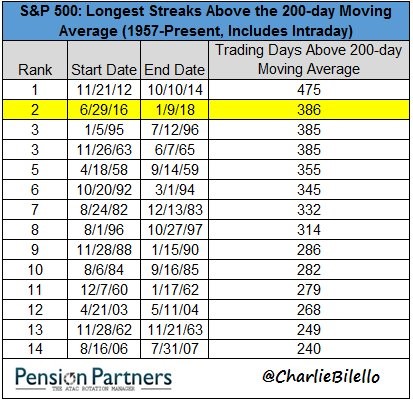
386 Days Above The 200 Day Moving Average
The record for consecutive new highs to start a year has been tied in the Nasdaq and the S&P 500 as stocks rallied again on Tuesday. As you can see from the chart below, the S&P 500 is in the 2nd longest streak where it has been above its 200 day moving average. Going back to 1957, this bull market has the top two records as the previous one ended in 2014 at 475 days. Going almost a record period without a 5% correction makes it almost impossible for the S&P 500 to fall below its 200 day moving average. This recent rally has caused the CNN fear and greed index to reach 76 out of 100 which is a signal of extreme greed. It got above 90 in the rally in the fall of 2017.
A Bitcoin Top Signal?
In other speculative news, Jamie Dimon, the CEO of JP Morgan, came out saying he regrets calling bitcoin a fraud because he believes in the blockchain technology. This is a common opinion on Wall Street, but it’s a big deal anecdotally because a big bear has sort of been broken because of the price action. Even though Jamie Dimon isn’t bullish on bitcoin prices, the fact that they rallied added to the pressure for him to clarify his position. Bears being heavily criticized shows how excessive speculation has become. Although the cryptocurrencies have sold off in the past few days, their total market cap is still $748 billion which is higher than it was a few weeks ago. With bitcoin at $14,800, it still hasn’t broken the all-time high it made in December.
Global Volatility Is Also Low
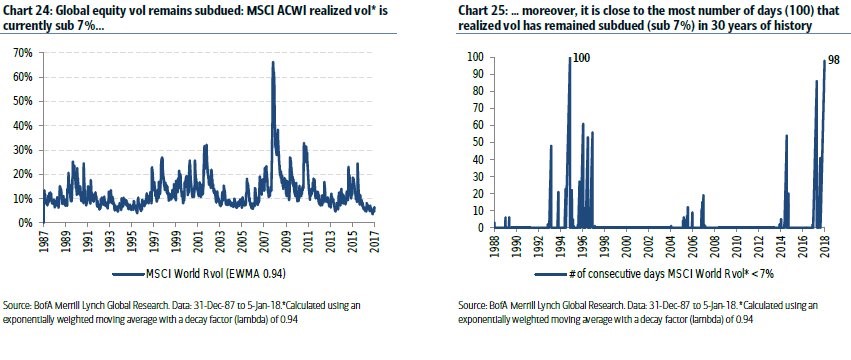
Keeping in tune with the American markets, which had the VIX remain at a 9 handle on Tuesday, global equities also have had a great run. As you can see in the chart on the left, the global equity realized volatility is below 7% which is about as low as it has been since 1987. The chart on the right shows that the MSCI all country world index has had a realized volatility below 7% for 98 straight days. The previous record was 100 days in 1994. There’s no reason to think it won’t be broken as emerging markets continue to push economic growth higher.
Effects Of The ECB Taper On Italian Bonds
As I have mentioned many times in 2017, the deceleration of global central bank asset buying is occurring this year. So far, there hasn’t been an effect on equities. I wouldn’t get too complacent about this because the Italian 10 year bond yield has risen from 1.651% on December 8th to 2.035% on January 9th. Also, the Bank of America Euro High Yield index went from 2.08% on October 30th, 2017 to 2.52% on January 8th. This might be a situation where there is an immediate effect on yields and then we see a freer flowing price which reacts to news events, meaning there would need to be a catalyst for rates to rise further. The fact that a catalyst could cause yields to spike is new. However, the ECB could always start another round of QE, if the market gets out of hand. The real panic will ensue when traders stop believing in the ECB’s ability to put out the fires.
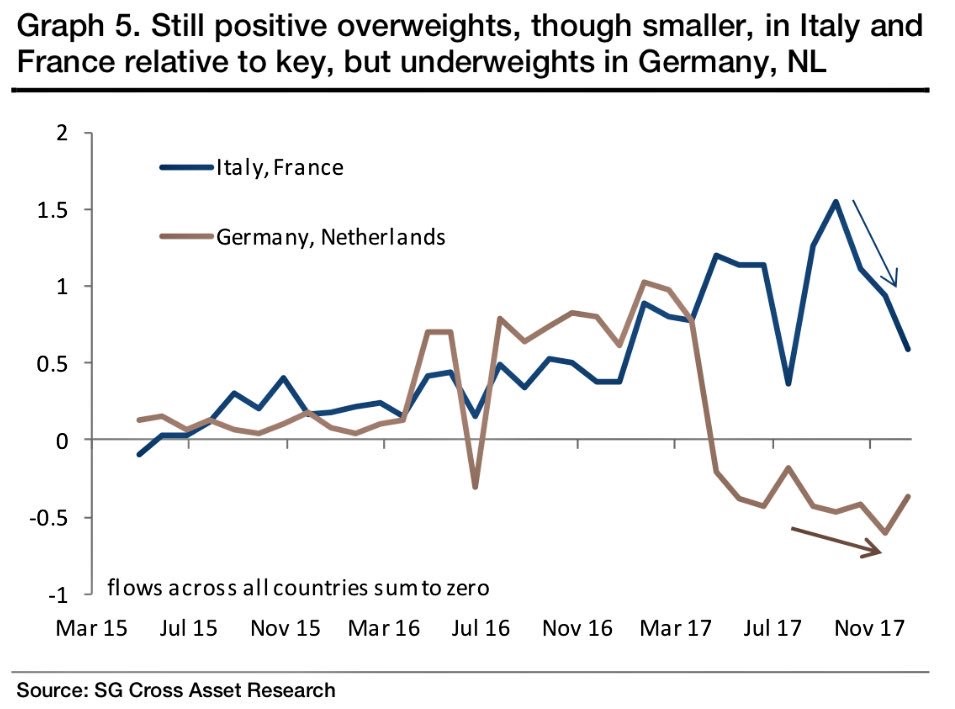
If fixed income is affected by the central banks’ change in policy, it will trickle down to equities at some point. As you can see in the chart below, even though the ECB is exiting its program at the end of this year, there were preferences in 2017. Italian and French bonds were bought over German and Norwegian bonds. If Italy has problems relating to its election, I could see the ECB trying to quell the situation by temporarily buying more Italian bonds just like how companies buyback more stocks when their stock has a correction.
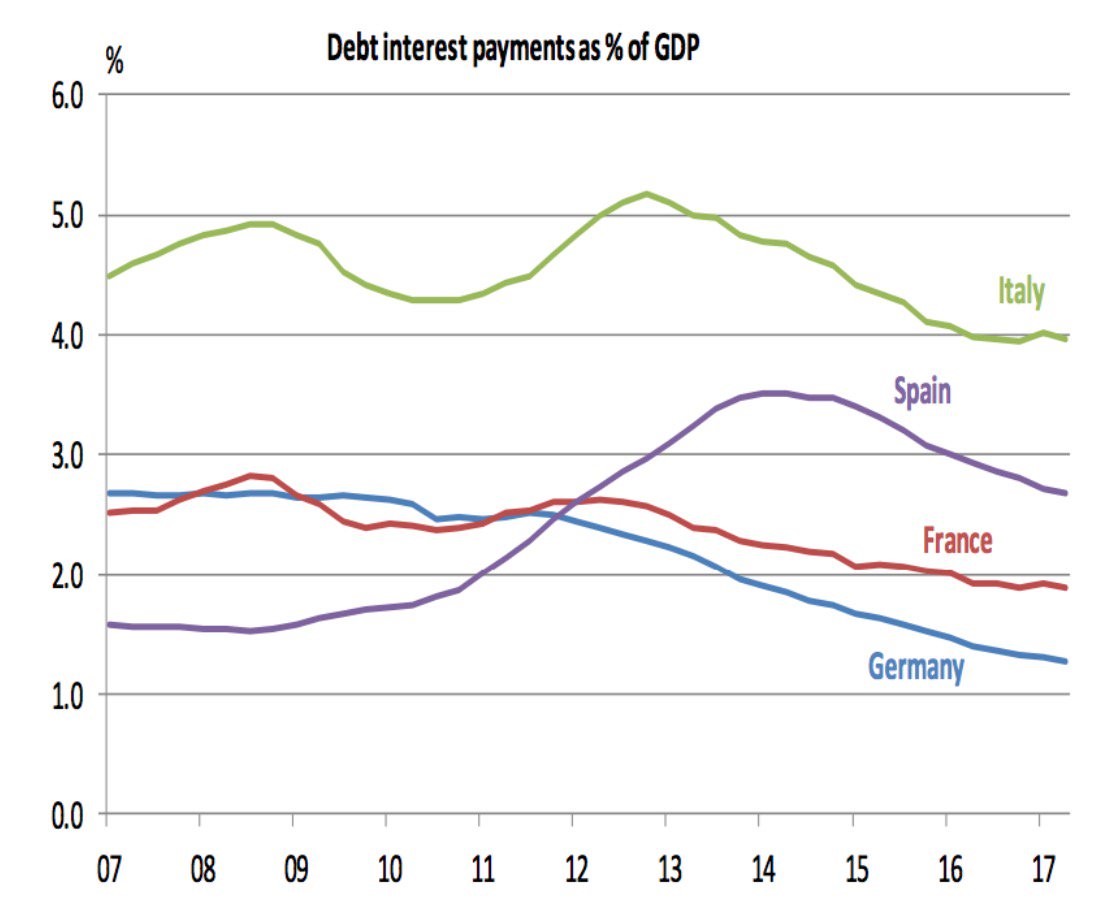
The chart below shows the dire situation Italy is in. Even as Italian bonds have had lower yield than American bonds of the same maturity date in 2017, the debt interest payments as a percentage of GDP have stagnated. If the bond yields in Italy start to increase in 2018, it will make the situation unbearable like it was in 2012. Therefore, some are calling for the Italian government to give investors a haircut or reprofile the debt. The problem with giving bondholders a haircut is it increases yields on new debt. The haircut would need to occur in tandem with a spending cut. Reprofiling means asking investors to give the country more time to pay the debt. This has worked for Greece as its 10 year bond yield has fallen from 14.63% in July 2015 to 3.686% today. Obviously, that decline in yields has occurred in a growing EU economy. Italy might not have that luxury in the next few years. The optimal time in the business cycle to make budget reforms may have passed.
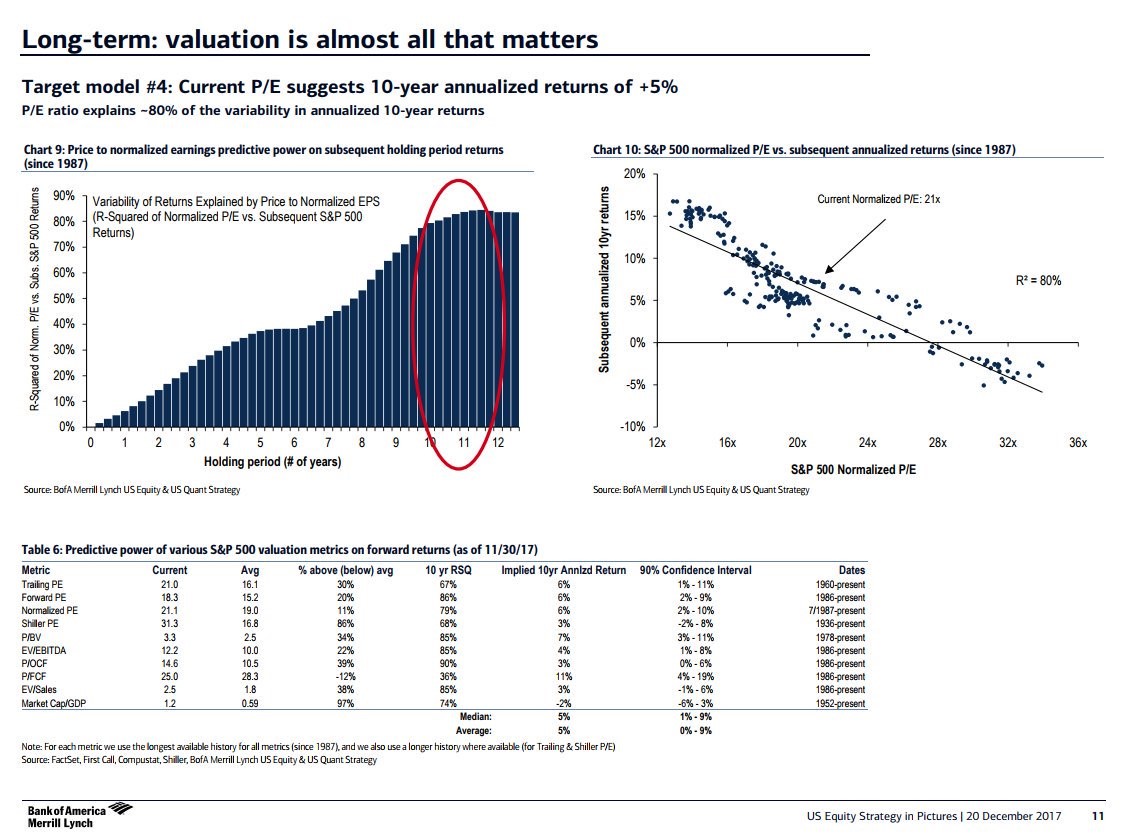
Valuations Aren’t In Lockstep, But General Idea Is To Expect Low Long Term Returns
With stocks making records everyday this year, smart investors are very worried about what this will do to long term returns because valuations are high. The Shiller PE is now at 33.43. As you can see from the slide below, the normalized PE explains 80% of returns over 10 years. The table at the bottom shows a few of the valuation metrics, their R squared (which is their ability to forecast forward returns, and what each valuation metric thinks returns will be. As of November 30th, the returns are expected to average 5% per year. Interestingly, the metric which is the most optimistic, price to free cash flow (11% returns), has the lowest 10 year R squared (36%). If you take out that metric, which has a terrible forecast rate, the average return falls from 4.7% to 4%. I think that’s close to where returns will be. The final thing to keep in mind is stocks have moved up 4.08% since the date of these calculations, so the expected return should slightly lower.