Stocks Press Their Luck
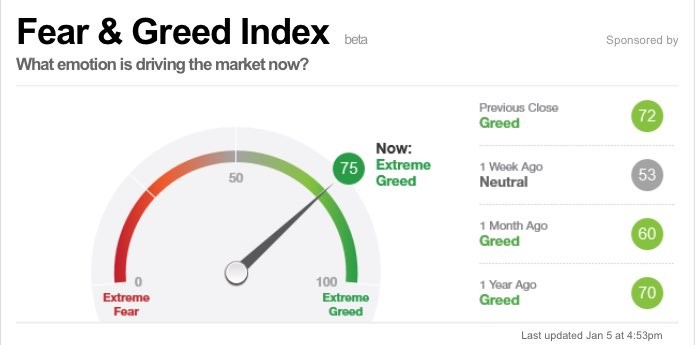
The first week of trading in 2018 ended with a bang as the S&P 500 was up 0.7% on Friday. It is up 2.6% year to date already. At this impossible pace, most year end price targets will be met by the end of the month. I remain steady in my expectation for the market to correct in the 2nd week of the year. As you can see from the image below, the CNN Fear and Greed Index is at 75 which is an extreme greed reading. One of the reasons stocks may have gone up is the jobs report which I’ll review later in this post. As expected, the oil market fell 0.92% as it is now slightly off the mid-2015 peak.
Great ADP Report Sets Up BLS Report
Before I review the BLS report, let’s look at the ADP private sector employment report which came out on Wednesday. The headline was amazing as it showed 250,000 jobs were created. This was the 3rd best report in the past 13 months. Small sized businesses improved in December as they added 94,000 jobs which was up from the 50,000 increase last month. Midsized businesses added 100,000 jobs and large businesses added 56,000 jobs. It’s very surprising to see the goods producing sector only added 28,000 jobs. Manufacturing only added 9,000 jobs even though most reports on manufacturing showed the sector brimming with growth and firms running out of people to hire. Sometimes the ADP report doesn’t make sense possibly due to errors in reporting. It doesn’t mean we should dismiss the ADP report in general, but it does mean you shouldn’t worry about the ‘lack of hiring’ in the goods producing sector because all other indicators show it’s doing well.
The service providing sector had a great month as it added 222,000 jobs. The professional and business sector added 72,000 jobs. The information tech sector lost 4,000 jobs. That’s the 5th straight month of job losses totaling 58,000 jobs lost. Clearly the tech sector is doing amazingly. The weak performance is probably related to the way the survey characterizes tech jobs.
BLS Report Misses The Mark
The BLS report was a miss as the headline showed 148,000 jobs created which was below the expectation for 190,000 jobs created. This marks the 11thtime in the past 14 months which saw the BLS report fall below the ADP report. Part of the reason the jobs report missed was weather related as there were a few snowstorms. If the snow pushed the December report lower, than I can only imagine how much the January report will be impacted by the winter storm at the beginning of this month which turned the mid-Atlantic and the northeast into a frozen tundra.
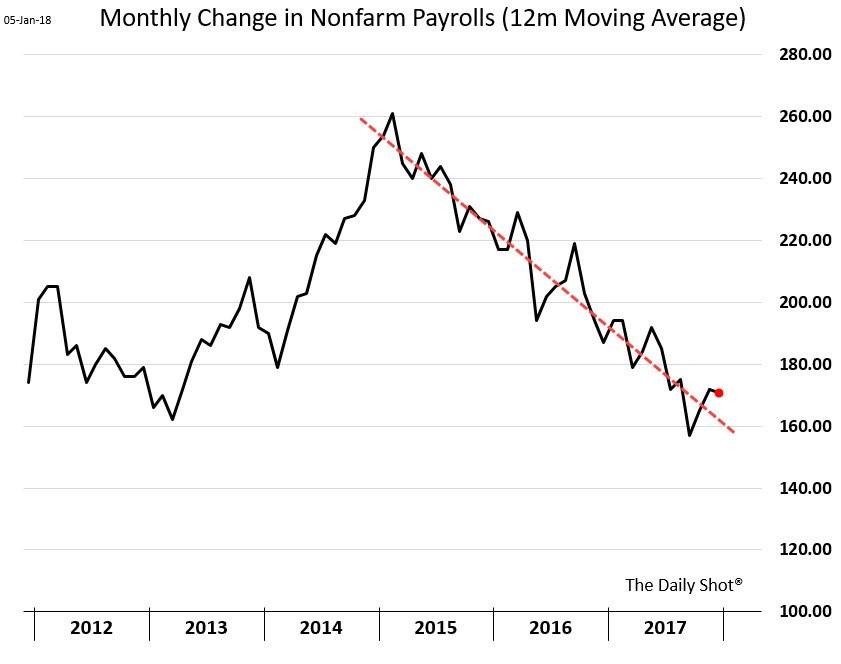
The October jobs report was revised down 33,000 jobs and the November report was revised up by 24,000 jobs. The unemployment rate stayed at 4.1%. One of the metrics some investors like Gundlach use to time the end of the business cycle is the year over year change in the unemployment rate. Obviously, the change is still down because it didn’t move up, but that’s something to consider in the next few months. The U6 unemployment rate increased from 8.0% to 8.1%. As you can see from the chart below, the 12 month moving average of the nonfarm payrolls report has been in a downtrend for the past 2 years. It’s not surprising to see the job growth slow because the labor market is tight.
The chart below shows why the growth in jobs created has slowed. As you can see, this is the 4th longest monthly streak of year over year gains in the nonfarm payrolls stretching back to 1939. Unless something unusual happens, this will be the 3rd longest streak soon. It’s about 25 months away from being the longest streak which isn’t surprising because this will be the longest economic expansion in 2019. If you ignore the 3 month moving average and just look at the raw month over month report, this is already by far the longest streak of jobs growth. This is also the longest streak of declines in the number of people employed.

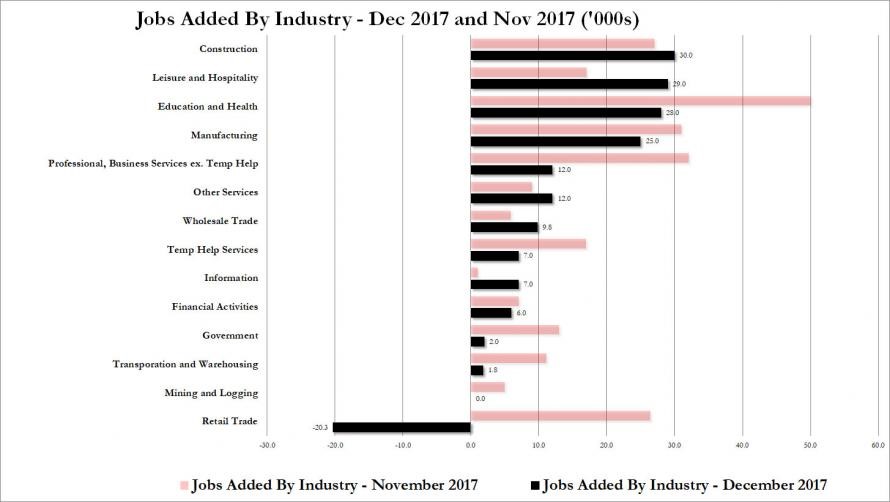
The labor force participation rate was flat at 62.7%. The number hours worked per week was 34.5 which met expectations. The average hourly earnings were up 0.3% month over month and 2.5% year over year which also met expectations. The chart below shows the breakdown in the change in job growth from November and December. Most of the metrics in December were lower than November since the November report had 104,000 more jobs added. As you can see, the industry with the biggest decline was retail trade. This is a reversal from the over 25,000 jobs added in November. This is likely because of the temporary nature of seasonal retail jobs. Surprisingly Macy’s and JC Penny had a good Christmas; the weakness in retail trade job growth wasn’t caused by weakness in the sector.
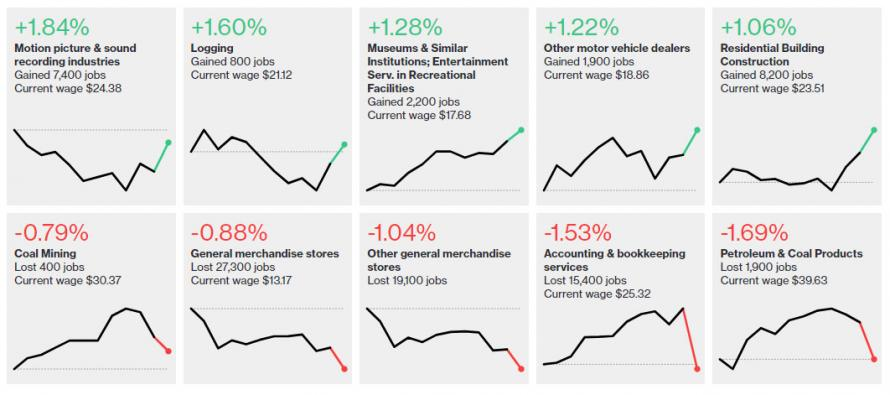
The charts below show the industries with the fastest and slowest job growth. In such small industries, it’s tough to draw conclusions. One point worth noting is coal probably added a lot of jobs in January because of the coal weather. Coal is now being relied upon more than natural gas. General merchandise stores had another bad month as their secular decline continues. Even though movie ticket sales have been in a multi year downward spiral, motion picture and sound recording industries saw a 1.84% increase in jobs added in December.
Conclusion
Some commentators said the market rallied because traders were happy the BLS report missed estimates because it means the Fed won’t raise rates. I don’t buy that argument because I don’t think the Fed will keep the economy on life support anymore. It’s also worth noting that most indicators show the economy is strong, so the Fed isn’t going to stop raising rates because of one weak jobs report. I think stocks rallied because the headline miss was due to weather. The hourly wage growth, which has been missing estimates routinely in 2017, finally met estimates. That’s another plus. The market has upward momentum, so there’s not much which can be said by the BLS which can stop the rally.