Bear Market Signals Triggered
In previous articles, we've reviewed the 30 risks for 2018. Now let’s look at the 19 bear market signposts. As you can see from the image below, 11 of the 19 signposts have been triggered already. The first trigger is the Fed raising rates by more than 75 basis points. This cycle, the Fed has raised rates by 125 basis points, so that has been met. Since 1982, every bear market has been preceded by over 75 basis points of rate hikes. We aren’t at the end of the rate hike cycle yet. The current estimate on the CME Fed Watch tool has the most likely scenario being that the Fed will raise rates twice by December 2018. There’s a 75% chance rates are raised at least twice. The second most common expectation is 3 rate hikes. There’s a 39.5% chance the Fed will meet its goal of at least 3 rate hikes in 2018.
The second signpost is tightening credit conditions. This hasn’t been triggered. The last 3 bear markets have started with the C&I lending standards tightening. C&I lending has been strong this year. It’s slightly off the high set in October. We’d need to see a few bad months is a row before anyone would worry about a recession.
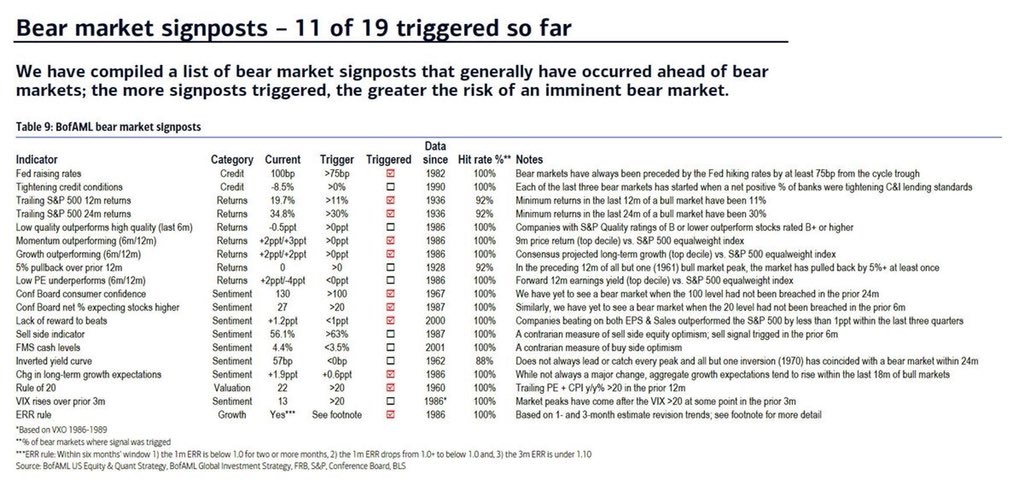
The third signpost is the returns of the S&P 500. In 92% of the periods before bear markets going back to 1936, the trailing 12 month returns in the S&P 500 have been over 11%. With the returns at 19.7%, that trigger has been met. I don’t think of this as a great warning sign because while bear markets have often occurred after excess returns are realized, stocks have rallied many times without a bear market following soon afterwards.
The fourth signpost is about S&P 500 returns again. In 92% of the periods before bear markets, the S&P 500 has returned over 30% in the prior 24 months. My opinion on this point is the same as the last one. Stocks may increase a lot before bear markets, but they also increase a lot during bull markets. This means I think 2 of these indicators so far are bunk.
The 5th signpost, which is low quality stocks outperforming high quality stocks, hasn’t been triggered. The S&P 500 stocks with quality ratings of B or lower have outperformed the stocks with quality ratings of a B+ or higher in 100% of the periods before bear markets since 1986. The S&P 500 quality index has increased 6.21% in the past 3 months. The quality score is determined by the return on equity, the accruals ratio, and the financial leverage ratio.
The 6th signpost of a bear market is momentum stocks outperforming the market. This signal has been hit. This signal is flagged when the top decile of stocks with the best price returns in the S&P 500 beat out the S&P 500 equal weight index. Since 1986, this has a 100% hit rate. The stocks like the FANG tech names have done well recently. In the past 6 months the momentum names have outperformed the market by 2% and in the past 12 months, they have outperformed by 3%.
The 7th signpost, which has also been hit, is growth stocks outperforming the equal weight index. A lot of the firms in the momentum segment are also in the growth segment. Speculation rarely occurs in the low growth consumer staples names and often occurs in the high growth tech sector. The determination of which stocks are high growth is made by looking at the top decile of long term growth estimates according to the analysts’ consensus. This indicator has also worked 100% of the time since 1986. Growth names have outperformed the S&P 500 by 2% in the past 6 month and the past 12 months. When both growth and momentum stocks outperform the market, it’s an indicator that speculators are driving the market higher.
The 8th signpost is the number of times the S&P 500 has pulled back by 5% in the past 12 months. This is a weird indicator because in most 12 month periods the S&P 500 has pulled back by 12 months. I don’t consider this to be a viable indicator. Yes, some volatility in the midst of a rapid rally is a sign of a coming bear market, but 5% is too little to matter. Either way, this indicator hasn’t been hit as there have been zero 5% correction in the past 12 months. Since 1928, this indicator has a hit rate of 92%. Only the 1961 bear market didn’t have a 5% selloff prior to its start.
The 9th signpost is low price to earnings multiple stocks underperforming over 6 months and 12 months. They have underperformed by 4% over the past 12 months, but they have outperformed by 2% over the past 6 months, so this signal hasn’t been triggered. When the top decile of firms with the highest earnings yields underperform the equal weight S&P 500 index, the hit rate for bear markets is 100% since 1986.
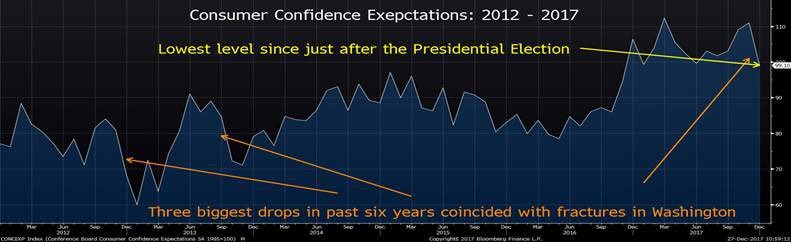
The final signpost we’ll review in this article is the conference board consumer confidence index. The index has been above 100 within 24 months of every bear market since 1967. This signal has also been triggered as consumers have been very confident this year. As I have previously mentioned, I think the consumer confidence will fall in the near term because of negative sentiment surrounding the GOP tax plan. My forecast has been accurate so far. As you can see from the chart below, the consumer confidence expectations index has had a sharp drop. It is now at the lowest level since right after the Presidential election.
Conclusion
I reviewed 10 out of the 19 signposts for bear markets. I think 3 of the indicators I reviewed so far aren’t valuable. That would mean 9 out of 16 bear market signals have been triggered if you assume the others that I didn’t review are all viable. We’ll see about that in the next article.
1 Comment
Fred
December 28, 2017Thx for information- will look forward to next article