Copper Bounces Off The Lows
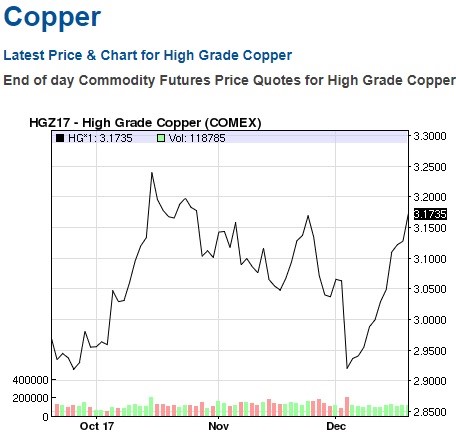
In a previous article, a couple weeks ago I discussed how copper’s decline didn’t mean you should get worried about the global economy. Sure enough, the price of copper, which you can see in the chart below, has rallied sharply back to where it started the selloff in October. Now some investors are claiming this rally is consistent with inflation increasing. Once again, I caution making prognostications based on the week to week price action in copper. This rally follows my narrative that inflation will pick up in 2018, but there needs to be more follow through than this. Increasing commodities prices and accelerated wage growth could be the combination that brings CPI near 3%.
Valuations Imply Caution
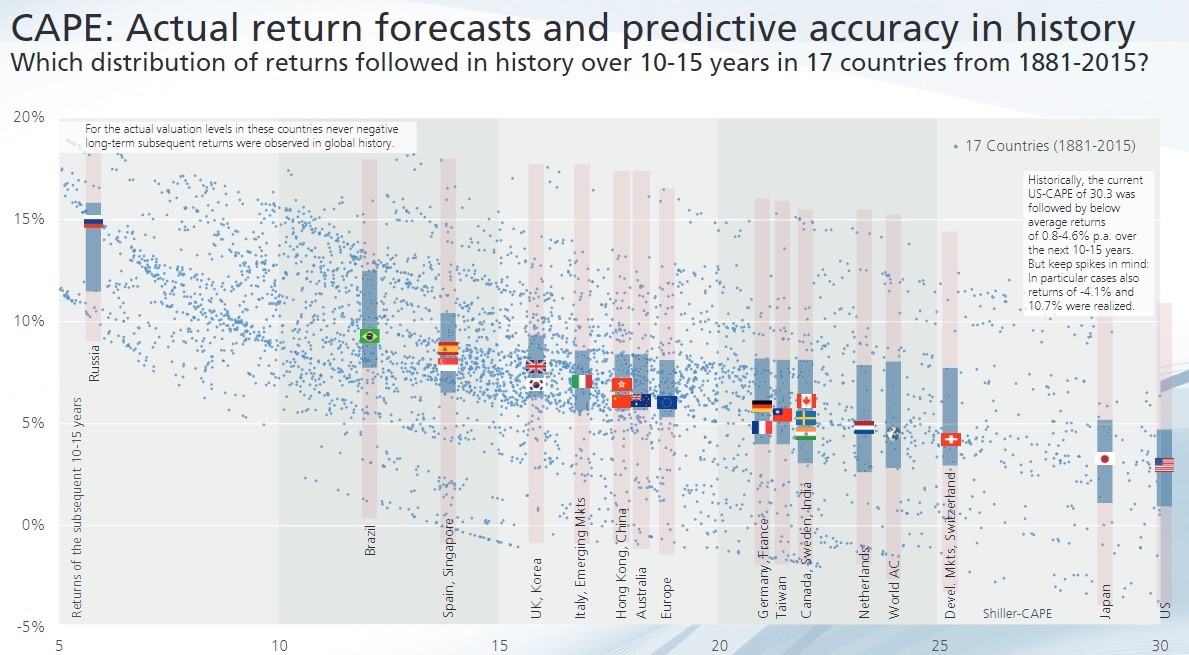
The Shiller PE recently passed the peak in September 1929. This means the market has only been more expensive in the 1990s bubble. The current Shiller PE is at 32.51. The mean is 16.80, meaning the market is nearly double the average. The maximum is 44.19. It was hit in December 1999. It’s tough to determine what these valuations mean because there are such little data points to compare the market to. Even going back to 1880 only leaves you with the 1990s bull market.
The chart below aims to contextualize what such high valuations mean. As you can see, the number of small dots decline as you get to the bottom right where America is. This chart is over a year old as it has the Shiller PE at 30.3. With the Shiller PE at 30.3, the average price appreciation per year is from 0.8% to 4.6% in the next 10 to 15 years. With a higher valuation, you’d expect the returns to be a bit lower. Low returns on stocks combined with heightened inflation can be a problem. The scary part is that it doesn’t look like there are any catalysts to bring the market down. The Shiller PE could get to 40 without a problem. The biggest catalyst that I see which could wreck the markets is if the crypto currencies’ collective market cap doubles from the $612 billion valuation it’s at now and then falls 80% in a short period. That would cause panic.
One Of The Least Volatile Years Ever
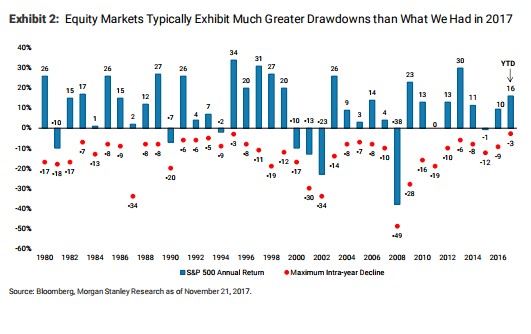
Now that the year is basically over, we can say that the max intraday drawdown in the S&P 500 of 2.8% this year is the 2nd lowest since 1928. The lowest was 2.5% in 1995. The chart below reviews all the max drawdowns in the past 37 years. The chart needs to be updated to show the 20% increase this year in the S&P 500. 20 years out of the 37 years listed below had at least a 10% correction. The longest streak without a 10% correction in this chart is the 6 year streak in the 1990s. The Dow’s max decline was 3.4% this year which is one tenth more than the max in 1995. The 70 record highs this year are a record.
Balance Sheet Forecast
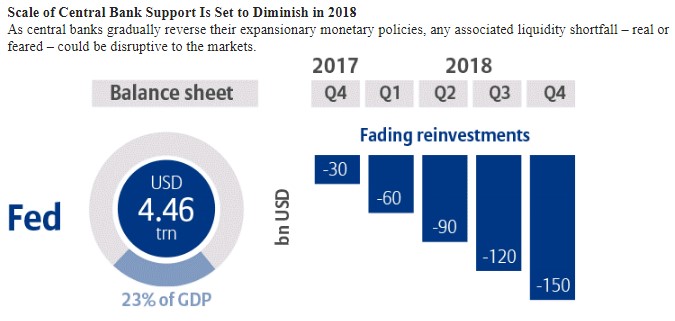
As I’ve discussed, the balance sheet reduction in 2017 was barely anything. It would be presumptuous to conclude future larger unwinds will have the same minimal effect on stocks. The reason why I am waning on my expectation for a selloff catalyzed by the unwind is that the guidance is already priced into the market. It would be weird for the market to crash based on something that’s expected. I think the next couple of years, especially 2019-2021, will be the peak of the unwind. The chart below reviews the expectation for 2018. As you can see, the first quarter has an average unwind of $20 billion per month. Q2 has an average of $30 billion. Q3 has an average of $40 billion and Q4 has an average of $50 billion. If the economy falters within the next couple of years, it can be devastating for the government’s financing costs because the tax cut will already increase deficits and the unwind and rate hikes will put pressure on yields to the upside.
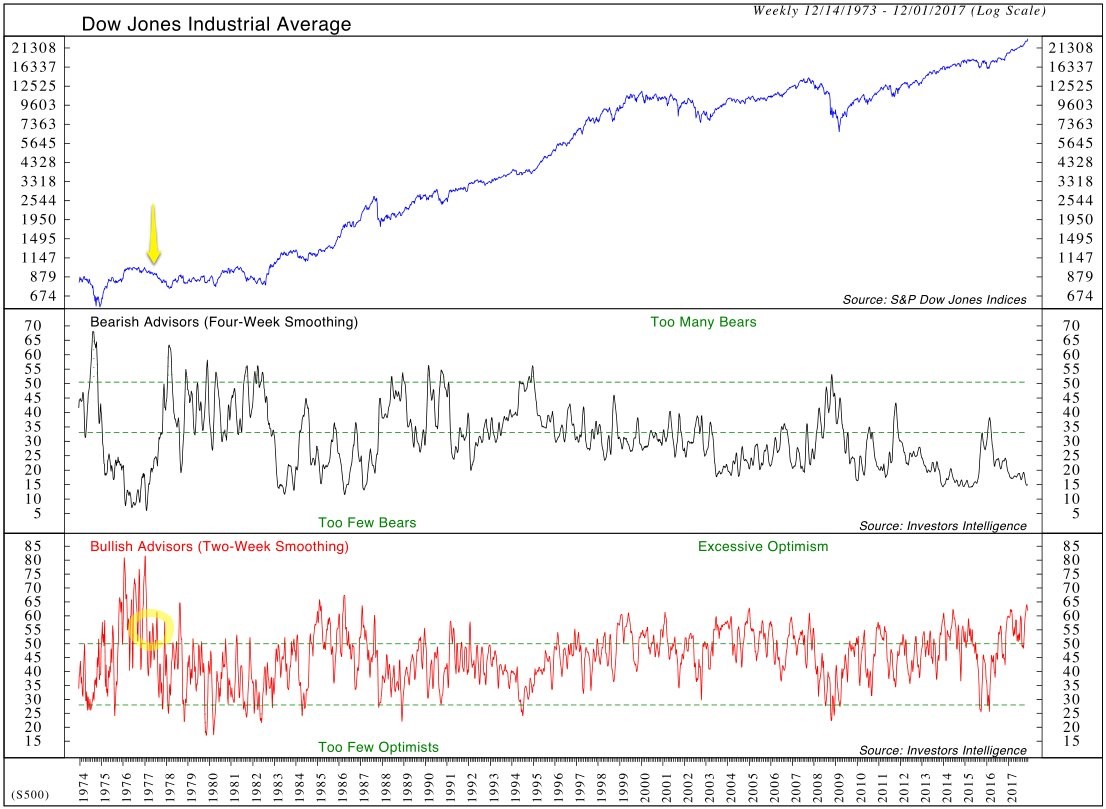
Euphoria Similar To The 1970s & The 1990s
As would be expected following a year where stocks rallied 20%, the optimism is palpable. The chart below gives a long term view of investor sentiment. As you can see, the last time there were this many bulls and this few bears was in the 1970s. The optimism in the crypto space emanates from the situation we are in. Financial conditions are loose and stocks are rallying. The ‘risk on’ moment is here. Some in the crypto space are such ‘believers’ in the technology, they can see no scenario where it can go own. They think it is up this year because of the advancement in the technology and the increase in users. Your advantage over these traders is the knowledge that when financial conditions tighten, there will probably be a selloff in these coins.
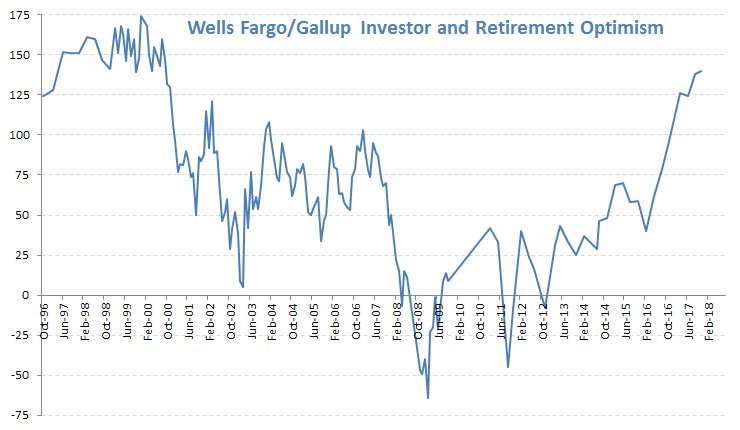
The other period which had euphoria was the 1990s. The chart below shows the Wells Fargo Investor and Retirement sentiment index. As you can see, the index was slightly higher in the 1990s. It is unspeakable to claim stocks will fall or have poor performance in the next 10 years. I focus most of my attention on the next 12 months, but I frequently mention that these could be the final outsized gains for a while. Be fearful when others are greedy.
Conclusion
I was right to disregard the sell off in copper in November and the beginning of December. In the past couple weeks, copper has regained its lost ground. A rally in the first couple months of 2018 will be enough to support my thesis that inflation will ramp next year. Accelerated Fed rate hikes could stymie the tax cut rally. It’s interesting to see how investor sentiment is so high, while professionals aren’t calling for 2018 to be a great year. Most are saying 2018 will see mid-single digit appreciation. This disconnect is something to watch in the next few months.