Tax Bill Timeline
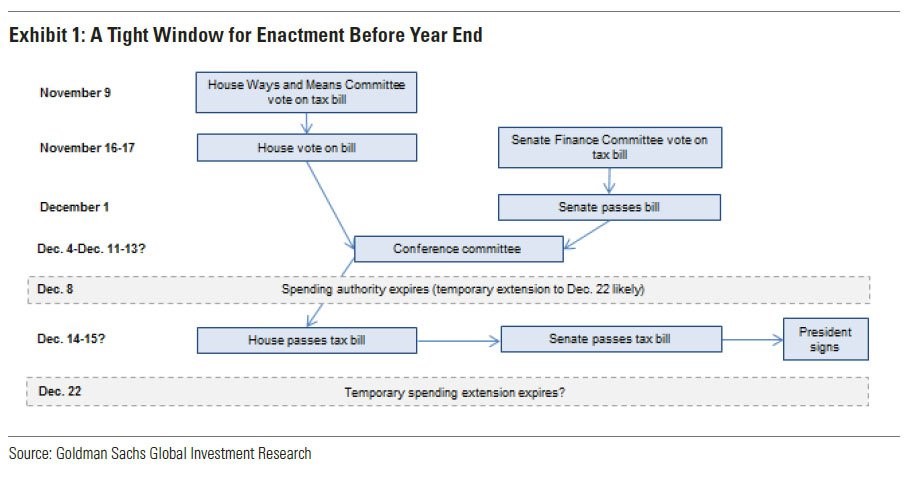
Monday’s market trading was affected by the changes in tax policy, once again, with the Dow underperforming the Nasdaq. Let’s first look at the timeline of the legislative process. The bill has gotten through the critical steps of passing the House and the Senate, but since both bodies passed different bills, there needs to be a reconciliation. As you can see from the timetable below, the bill is expected to be in the conference committee for the next 2 weeks. The conference committee reconciles the differences between the two plans.
Differences Between The House & Senate Plan
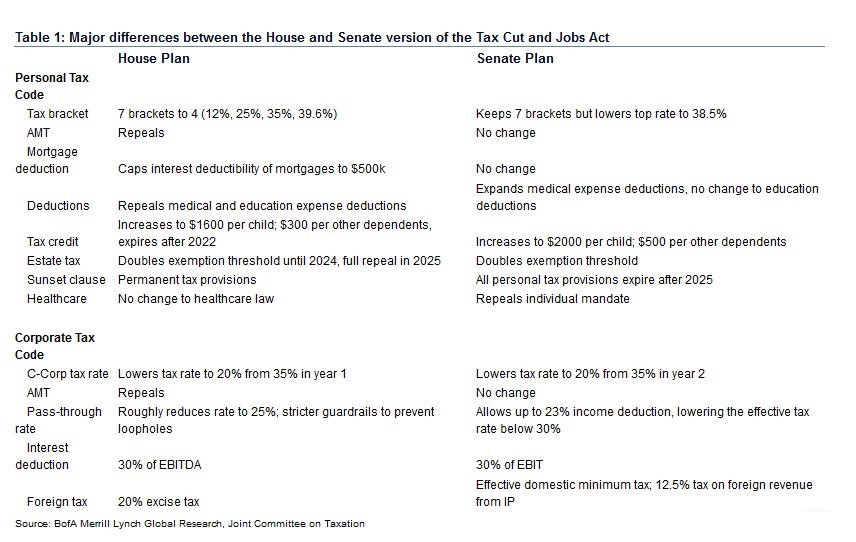
The first difference is the Senate plan has the alternative minimum tax for corporations, but the House version repeals it. The second difference is the House plan has 4 tax brackets, with the top rate at 39.6%, while the Senate has 7 brackets, which is how many there are now, with the top tax rate at 38.5%. The third difference is the Senate plan keeps the mortgage interest deduction cap at $1 million, while the House version caps the deduction at only $10,000. The final major difference is the House plan doubles the estate tax exemption and eliminates it in 10 years, while the Senate plan doubles it, but leaves it in place.
The image below lists all the differences between the plans, some of which I didn’t mention. As you can see, the Senate plan is closer to what we have now, while the House plan is closer to what the President wants. The Senate only passed its plan with 51 votes. Given the fact that the House plan adds more to the deficit, I doubt Corker will come back on board when the reconciliation plan is voted on. Any of these differences can cause one or two Senates to balk at the plan. This means the Senate has more leverage. Therefore, I think the final version will look more like the Senate plan than the House version.
The Odds Of It Passing
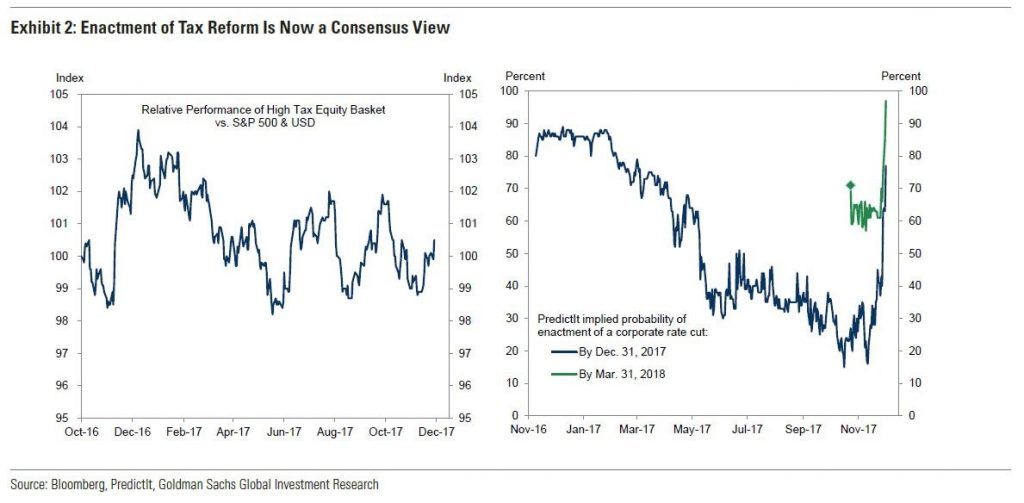
I think the plan will be worked out, but it’s far from a foregone conclusion. The PredictIt website has the odds of an individual tax cut by the end of the year at 66%, the odds of a corporate tax cut at 83%, and the odds of the individual mandate being repealed at 76%. The stock market has been pricing in the tax plan for the past few trading sessions. The stock market always tries to calculate the odds of an event happening before it does. This means by the time the plan is signed by the President in 2.5 weeks, it will be about 95% priced in to the market. The only parts that might not be priced in are the last-minute changes. You’re more likely to get lucky by profiting off the current headlines during this time of year because trading is light right before Christmas.
Spending Authority Nears Expiration
The other aspect in the timeline which I haven’t discussed is the spending authority deadline. The federal agency spending authority expires on December 8th. As you can see, a temporary authority will likely be passed which will last until December 22nd. To be clear, the Congress’ year ends on December 15th. It can alter it by a few days if something needs to be finished. On the substantive issues of the spending authority, the Democrats want non-defense and defense spending to go up equally, while the GOP wants defense spending to increase more than non-defense spending. The solution after the temporary extension would be to put the fiscal year spending (until next September) in a catchall bill or extend the current spending rate for another month. Sometime next year, the debt ceiling issue will pop up again. The Treasury will give an estimate for the debt ceiling deadline on December 15th.
Pricing In The Tax Bill
As I mentioned, the tax bill is expected to pass. The chart on the right shows the odds of it passing by December 31st are near 80% and the odds of it passing by March 31st, 2018 are near 100%. The issue is no longer whether it will pass; now, the issue is what will be in the final bill. The chart on the left shows the relative performance of the high tax equity basket compared with the S&P 500 and the U.S. dollar. As you can see, the high tax equity basket hasn’t done well considering the bill looks like it will pass. I think this basket must be poorly constructed because the market has priced in the tax cuts being passed. I think, after the 2016 election, stocks which were considered to possibly benefit from a tax cut were pushed higher. Then, after a few weeks, investors figured out the specific firms that would benefit and moved those up. The basket didn’t adjust for the specific analysis the market did. That’s why doing a stock screener isn’t enough when investing. You need to get to the details of the taxes paid to figure out which firms will benefit the most. Clearly, the PredictIt odds were more accurate than the basket since the basket doesn’t reflect the Senate passing the bill which certainly improved the odds.
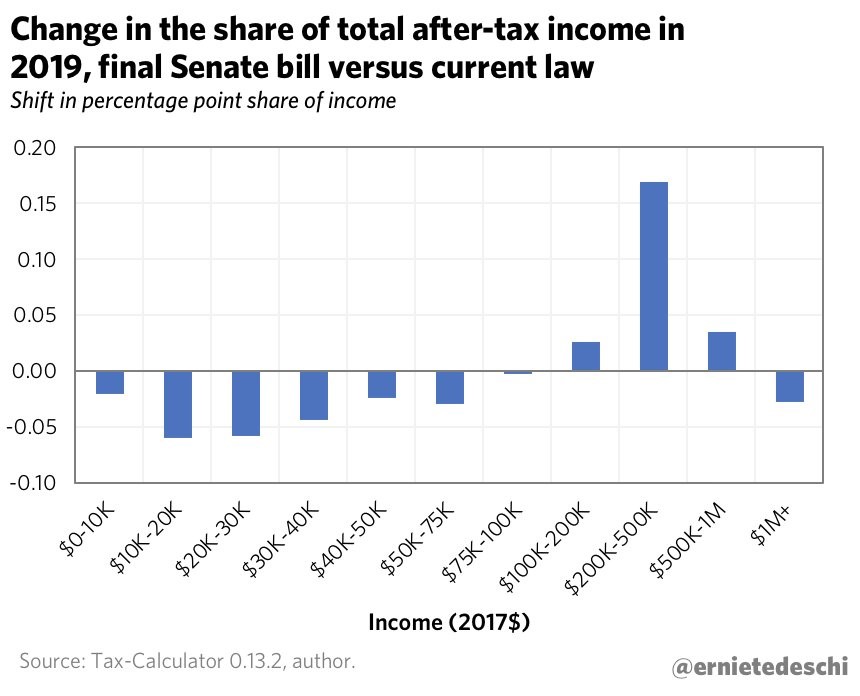
Final Senate Bill Adjustments
As I said, the final details of the bill will be changed to make sure it passes. The chart below shows the differences in after tax income in 2019 between the original Senate bill and the final one. As you can see, almost every group was hurt except those making between $100,000 and $1 million. The biggest beneficiaries of the recent changes are those making $200,000 to $500,000. There were concerns that the upper middle class might see a tax increase in the states with high tax rates. You’d expect the $75,000 to $100,000 earners to be helped to solve that problem, but they weren’t. Keep in mind, the House’s plan offers more tax cuts in general than the Senate plan. The final agreement will be different. This just shows the changes to the Senate plan over the past few weeks.