Neel Kashkari: Minneapolis Fed President Is Fine With 2.7% Inflation
On the day of the release of the Beige Report which showed price pressures are strengthening as economic growth is steady, let’s review a comment Neel Kashkari made about inflation. Neel did a Q&A on Twitter. One of the questions asked was what level of inflation the Fed would need to see to increase rates considerably. He said that because the PCE was 1.3% for over 5 years, the Fed should be fine with inflation running at 2.7% for over 5 years. I’ve never understood the mandate to be like that. He said that’s why it’s called a target and not a ceiling. The way I thought of inflation is that the goal is for it to be near 2%. While being above 2% is fine, if it is above 2% and the Fed thinks it’s headed higher, the Fed raises rates to prevent it from getting higher. It would be interesting to see the ECB having that philosophy because its inflation rate has been even lower in the past few years.
If the Fed thinks the way Neel does about inflation, it won’t raise rates an accelerated clip if inflation picks up next year. That’s important because the market expects the Fed to raise rates about twice in 2018. If inflation picks up, some would expect the number of rate hikes to increase. However, if the Fed is fine with inflation running near 3%, then we might see the same amount of rate hikes. Neel has been someone who would like to see wage gains, meaning he thinks the Fed shouldn’t raise rates much more until there are a few quarters of accelerated wage growth. It remains to be seen what Powell’s Fed does. I trust that the market has all the facts when it comes to Powell’s opinions and the opinions of the other new FOMC members. Therefore, unless he changes his mind through guidance. The percentages should reflect reality. Currently, the top two guesses the market has are 1 hike and 2 hikes in 2018. The hike in 13 days is already locked in.
The Best Streak Ever?
With the volatility very low this year and great stock returns continuing, it’s interesting to see how this bull market stacks up against previous ones. The chart below takes a portfolio of 60% stocks and 40% bonds and stacks the performance in each bull market. As you can see, this bull market has lasted 8.7 years which is the 2nd longest ever. The longest ever was in the 1920s as it was 9.1 years. While this bull market will probably pass that one in length, it’s doubtful the returns will equal the 376% gains then. The 1950s bull market also had better returns.

2017 Was A Weak Year For M&A Activity
One of the under-reported trends in the past year is the decline in M&A activity. In the past two cycles, the M&A activity fell before the recession occurred. Since the M&A activity peaked in 2015, there needs to be a recession relatively soon to keep this indicator’s predictive value intact. I don’t think there will be a recession in the next year because the financial conditions are so loose. According to the Chicago Fed Financial Conditions index, there were signs of tightness in late 1998 and mid-2007 which ended up correctly forecasting a recession. Now the conditions are very loose, so the reason M&A activity has declined isn’t because of tight conditions. Obviously, this indicator is worth watching, but sometimes M&A can be lumpy. 2018 might be a strong year for this activity, rescinding the recession warning.
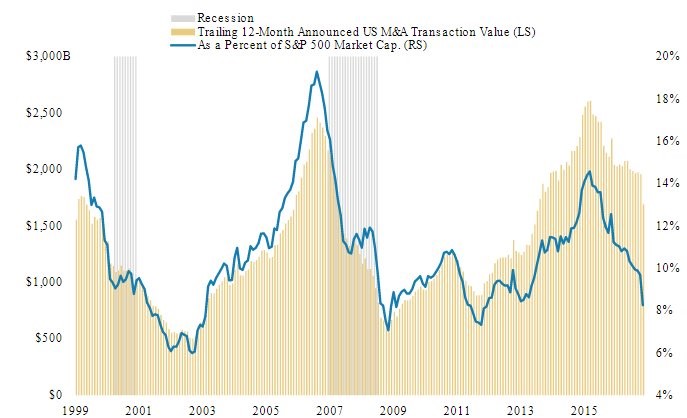
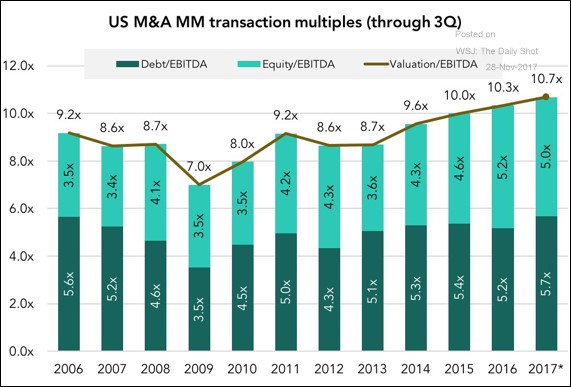
One of the reasons M&A activity might be weakening is because valuations are stretched. As you can see in the chart above, the peak in 1999 was lower than 2007 as a percentage of the S&P 500 even though the 1990s economy was stronger and the expansion was longer. The peak in activity in 2015 is near the 1999 peak, which adds a further comparative mark for the two cycles. The other two marks being the length of the expansions and the excessive speculation in cryptocurrencies and tech stocks respectively. The chart below supports my point that valuations are getting too high to do deals. As you can see, in 2017 the EBITDA multiple for deals was the highest in the past 11 years. If the valuations were the same as 2007, the activity would probably be higher.
Wage Growth About To Accelerate
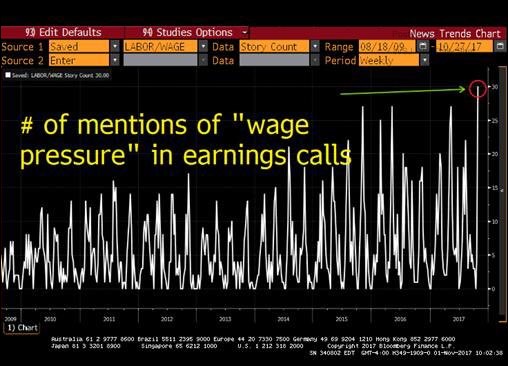
The themes of 2017 were disappointing inflation, euphoria in cryptocurrencies, and low volatility in stocks. I think one of the themes of 2018 will be improving wage growth. The chart below supports my point as the number of management teams mentioning the term “wage growth” on earnings calls was the highest of this economic expansion in the latest quarter. This could be nothing because the mentions were high in 2015 and 2016, yet wage growth didn’t accelerate. Maybe some conference calls were talking about the expectation of wage pressure. Expectations aren’t always met. Surely, the Fed is painfully aware of that factor as wage growth hasn’t met its estimates.
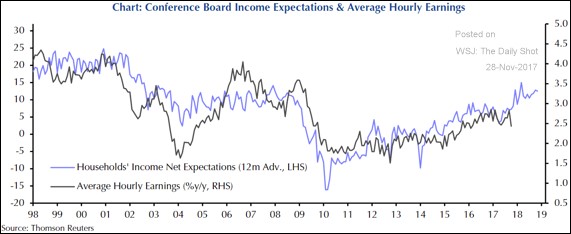
Speaking of meeting expectations for wage growth, the chart below shows the Conference Board’s income expectations as compared with actual average hourly earnings growth. As you can see, the Conference Board has been mostly accurate in predicting wage growth. The prediction for 2018 is for the wage growth to get close to the rate seen in the last cycle which means growth above 3%. Wage growth is a lagging indicator. You can tell that by the fact that it is only now peaking after this expansion has been going for almost 9 years. You can see that wage growth only started to decline in early 2009 when the recession was almost over. That means we could see strong wage growth next year along with a recession. I’m not saying that will happen, but it’s a possibility. A recession will probably occur sometime in 2019 or 2020.