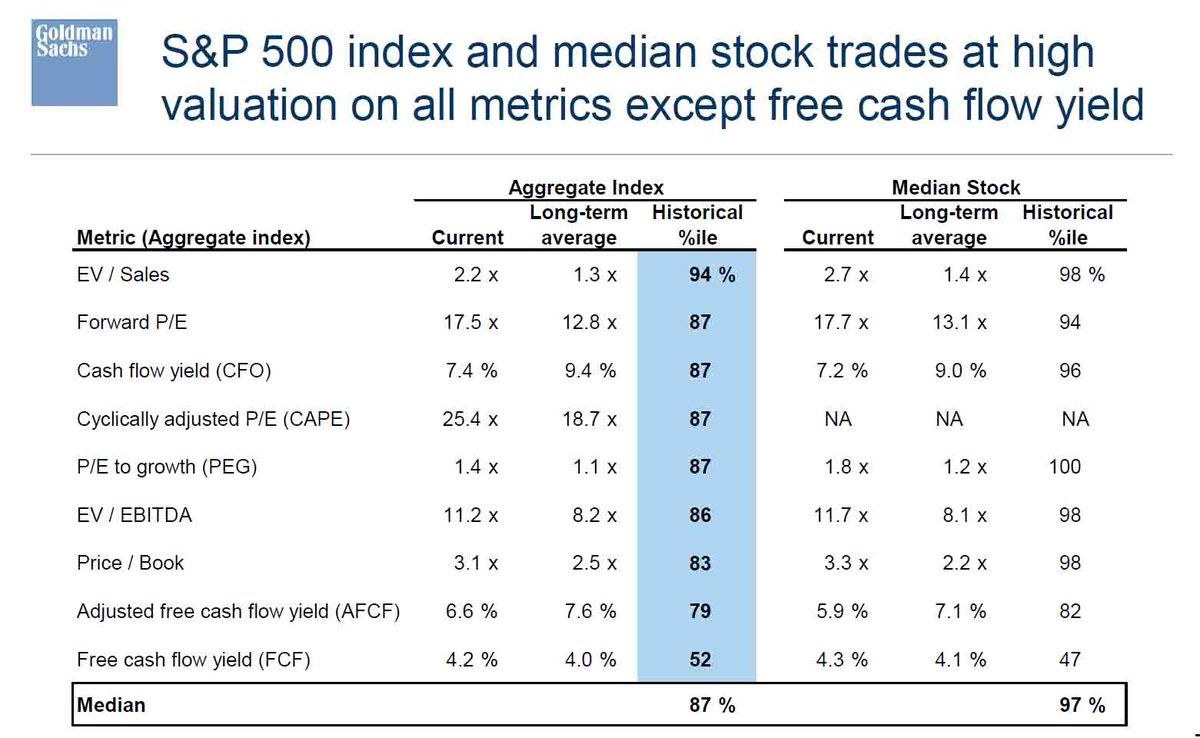
Stocks Are Expensive
The current market is expensive, but earnings momentum and global growth from the emerging markets are keeping the stock market up. The time the expansion has left is dwindling as the yield curve has been flattening lately. However, the last couple years of gains in a bull market are usually the highest, so that doesn’t mean you want to sell out yet. Having a heightened cash position is logical, but only gradually sell when stocks go up. You can also buy on the next dip. Corrections still happen even though there hasn’t been one this year. To support the concept that the stock market is expensive we have the table below. It shows the latest S&P 500 valuation by looking at the total index and the median stock. As you can see, current valuations are in the 87th and 97th percentile respectively. No one can argue the market has low multiples, but it’s easy to see why stocks will go up in the next few months.
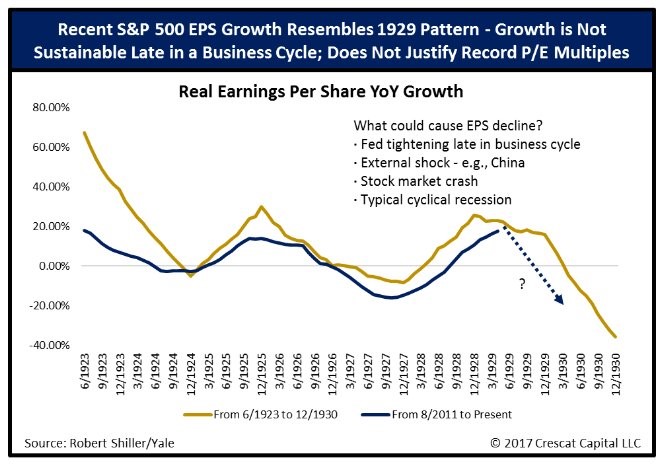
Scary Comparison
The chart below compares the current environment with the 1920s. I am not a fan of comparing current charts with past ones that led to a crash. History rhymes, but it doesn’t repeat. While I think the EPS growth comparison isn’t valid, the bullet points shown are mostly valid. The Fed tightening late in a business cycle isn’t good news. The end of the cycle might occur in the next few years. The earnings comparisons will be tough next year, making the dotted line a possibility It’s just as likely that this guess occurs as the ones which claim the earnings growth will be in the double digits for the rest of eternity. An external shock is possible, but I disagree with the notion that China will cause it. China doesn’t operate with the same capitalist standards that America operates under, so I don’t think the leverage will collapse the way U.S. housing did in 2007. There’s a possibility China’s positive 2017 won’t be repeated, but I don’t see a crash in the cards. Eventually you need to reevaluate the notion of crash when those who have been predicting one have been wrong for several years. If they had been bearish on growth, they would’ve been correct, but they went overboard, predicting a collapse which didn’t happen.
Stock Market Sensitivity To Rates
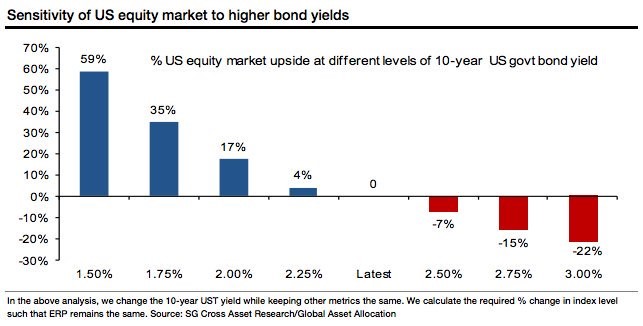
Some of the bears still argue that low rates don’t justify heightened valuations. I can’t go along with that logic because we’ve seen the historical data which shows stocks have higher multiples on average when rates are low. It’s tough to make the case that the past few decades of trading are wrong, but you’re right. You don’t need to justify buying stocks with low rates, but others will. The bearish narrative which is more reasonable is that rising rates will cause stock multiples to fall. If earnings grows along with rising rates, stocks will be stagnant. If earnings are weak in a rising rate environment, then stocks will crash.
The chart below gives a sensitivity analysis of how stocks might perform with various changes in the 10 year bond yield. As you can see, the stock market falls 22% if the 10 year bond rallies to 3.00%. The good news is that rates often rise at the prospect of increased nominal growth. If that growth comes with low inflation, stocks should be stable. If the growth comes with inflation, it is bad news for stocks. As you can see, there are many variables when it comes to the stock market. All things being equal, higher rates mean lower multiples, but all things are never equal. There needs to be a reason for rates to rise. As I said, if that reason is increasing real growth, it’s not a disaster.
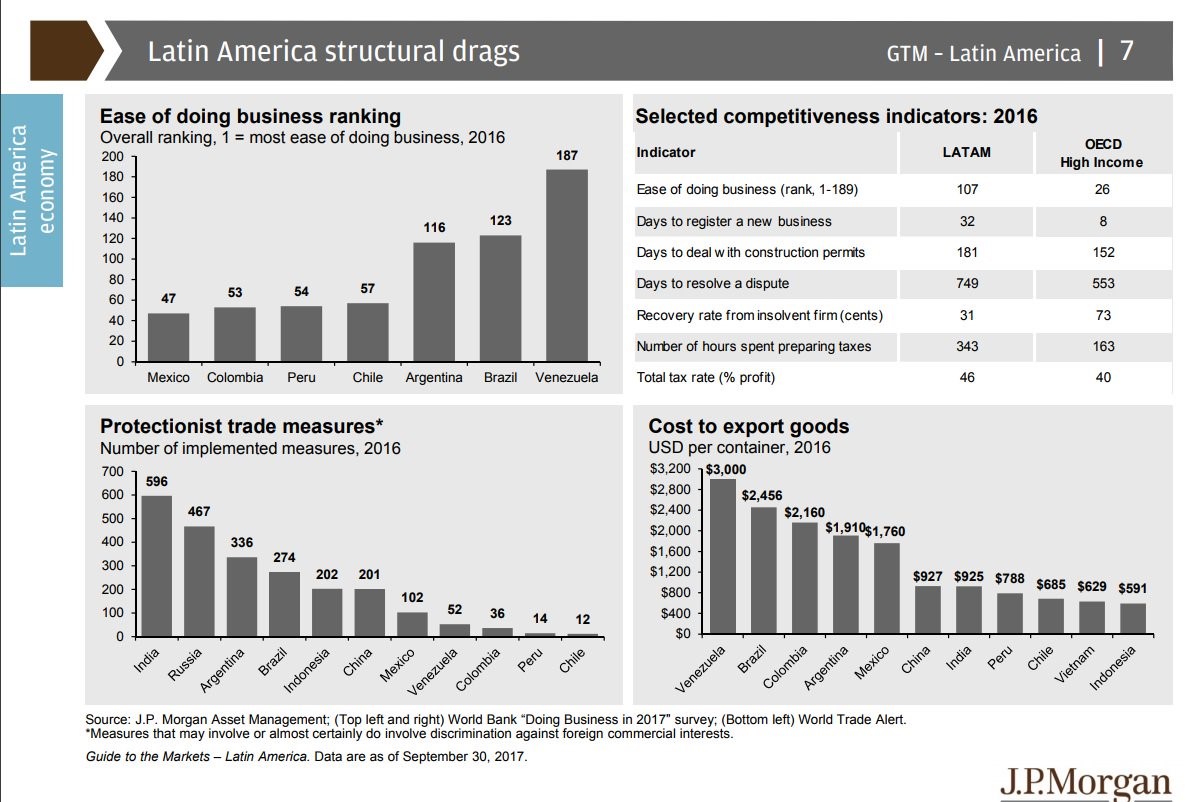
Structural Problems In Latin America & India
The global economy is being helped by the developing nations this year. The equity performance of the MSCI Emerging Markets Index has been phenomenal as it’s up 32.81% year to date which is the best yearly performance since 2009. The chart below puts a damper on some of the optimism. As you can see, the Latin American markets are terrible for doing business. Clearly Venezuela is a disaster as the country suffers from hyperinflation. The fact that Brazil is one of the worst countries to do business shows it’s still in need of reform over a decade after it was named a part of the BRIC nations which were supposed to be the top emerging market countries. Another member of the BRIC, India is also in one of the charts below. As you can see, it has the most protectionist trade measures which are even worse than Russia’s measures. This will limit economic growth. Prime Minister Modi and Prime Minister Abe of Japan recently agreed that a rule based multilateral trading system is necessary for growth. The two leaders agreed to fight protectionism. That sounds great, but India has seen decelerating growth in 2017 which could be blamed on the demonetization effort Modi put in place last year.
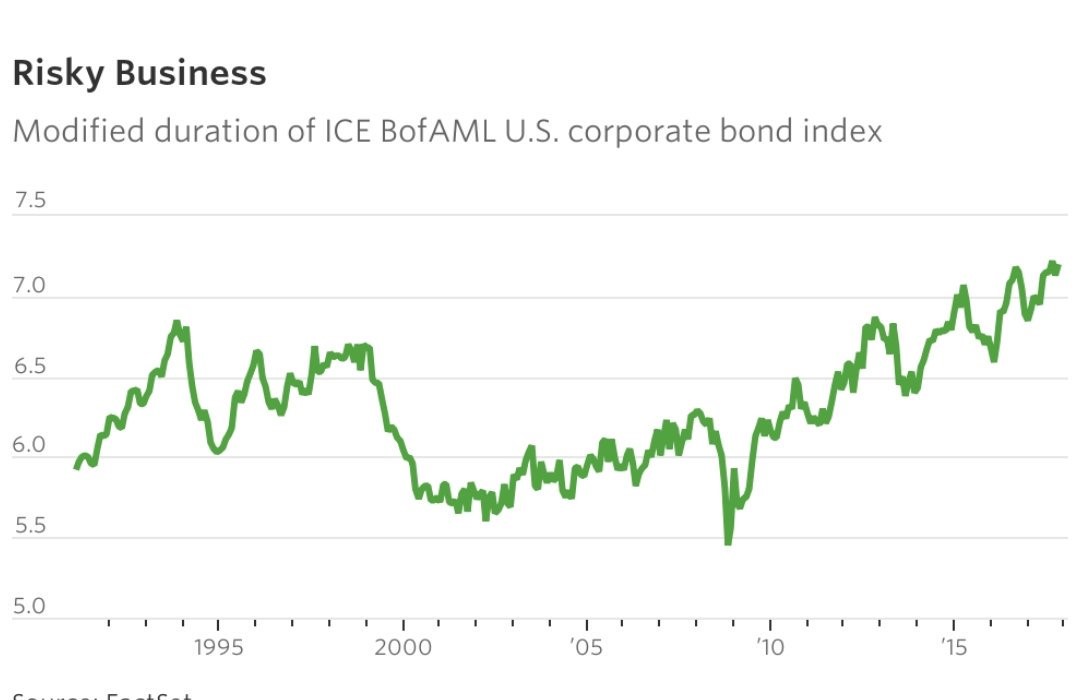
Corporate Bond Duration Risk
The final negative chart we’ll look at is corporate bond durations. The higher the duration, the more interest rate risk. The tight credit spreads and high duration risk make these bonds vulnerable to economic weakness and problems with corporate earnings. Higher corporate bond yields would bring down stock multiples, ending the bull market in financial assets.
Conclusion
We reviewed some of the bearish arguments to stay cognizant of the risks the market faces. With the S&P 500 0.47% off its all-time high, there’s no better time to review what can go wrong. When the momentum reverses, there is a lot of downside in stocks because of how expensive they have gotten. One indicator to keep in mind is when the unemployment rate starts to increase on a year over year basis. With the current rate at 4.1%, that metric could be flashing a warning sign in 12 months.