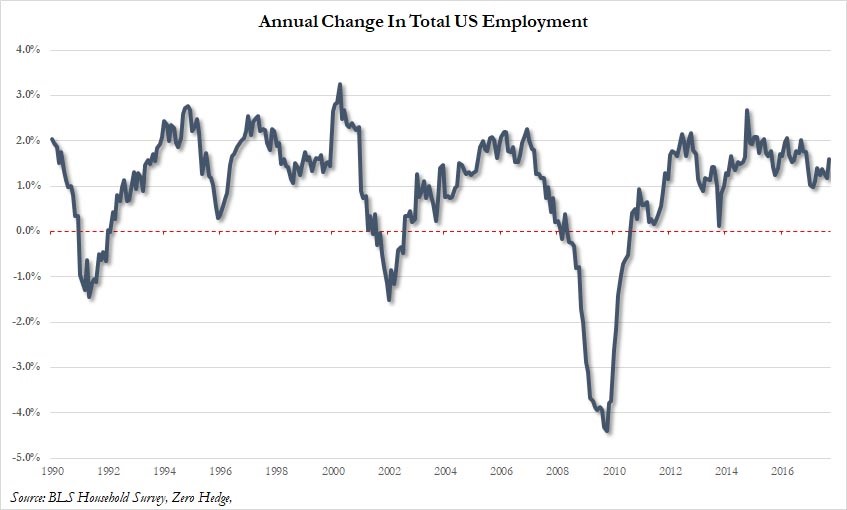
As expected, the employment report was severely impacted by the hurricanes. It was hurt much more than I thought or what the consensus expected. The expectation was for 90,000 jobs created, but the results were a 33,000 decline. Not only was September’s number weak, but the combined revision of the past 2 months was 38,000 less than previously reported. The July report went down from 189,000 to 138,000 and the August report went from up 156,000 to 169,000. The good part of the report was the improvement in U.S. employment according to the household survey. As you can see from the chart below, the number of employed people was up by 906,000 to 154,435,000. That’s a 1.6% increase from last year. The unemployment rate fell to 4.2% from 4.4%.
The unique part of this report was obviously the effect of the weather. The BLS report showed 1.5 million people couldn’t get to their job because of the storms. That’s the highest amount since the 1996 blizzard. This helped cause a labor shortage which we’ve seen in the Fed surveys I’ve reviewed. This caused hourly earnings to increase 0.5% month over month which is better than the 0.2% growth last month. Year over year hourly wage growth was 2.9% which is above the 2.5% expected and the highest of this cycle. The economists clearly didn’t bother to alter their expectations because of the storms even they knew there would be a big impact. This gives you an idea of what would have likely happened if it wasn’t for the storms. It’s amazing that the stock market didn’t care much as the indexes were mixed. The S&P 500 was down 0.11% which ended its 8 day winning streak. This is like a stock which runs up before it reports earnings and then earnings are a disaster. Usually when that happens the stock crashes. In this case, the market didn’t care about the bad numbers and only focused on the good ones.
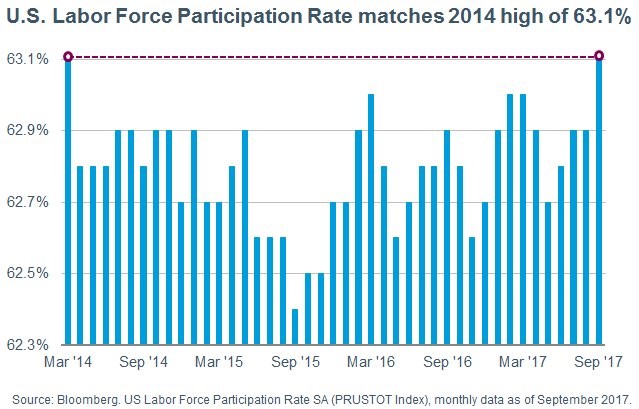
One of the good numbers was the improvement in the labor participation rate. The rate increased from 63.1% to 62.9%. The labor force declined by 368,000 people even as there were 906,000 more employed people. Looking at the components of report, it showed that there was a 935,000 increase in the number of full time jobs which was 4th highest monthly print ever. There were only 81,000 more part time jobs.
Let’s look at the breakdown of the sectors in the report. The sector biggest impacted by the storm was leisure and hospitality. The sector lost 111,000 jobs as you can see from the chart below. The revisions might push this number higher because there was an increase in service at the restaurants and hotels that the people who fled the storms went to. If you were to flip the 111,000 decline to a 15,000 gain, the report would have showed 93,000 jobs created which was about what economists were expecting. Even though they lowered their expectations, they weren’t near what ended up occurring. As I said, the biggest impacts from this storm will be in the employment numbers and the profit margins of S&P 500 firms. The increase in wage inflation and increase in raw materials prices pushed up costs temporarily which likely hurt these firms. The GDP report is actually looking like it’s being helped by the storms because the rebuild has started earlier than I expected. Judging by the jobless claims, Houston is about back to normal. That latest report was from the last week of September, showing that much of the rebuild occurred in the second half of September.

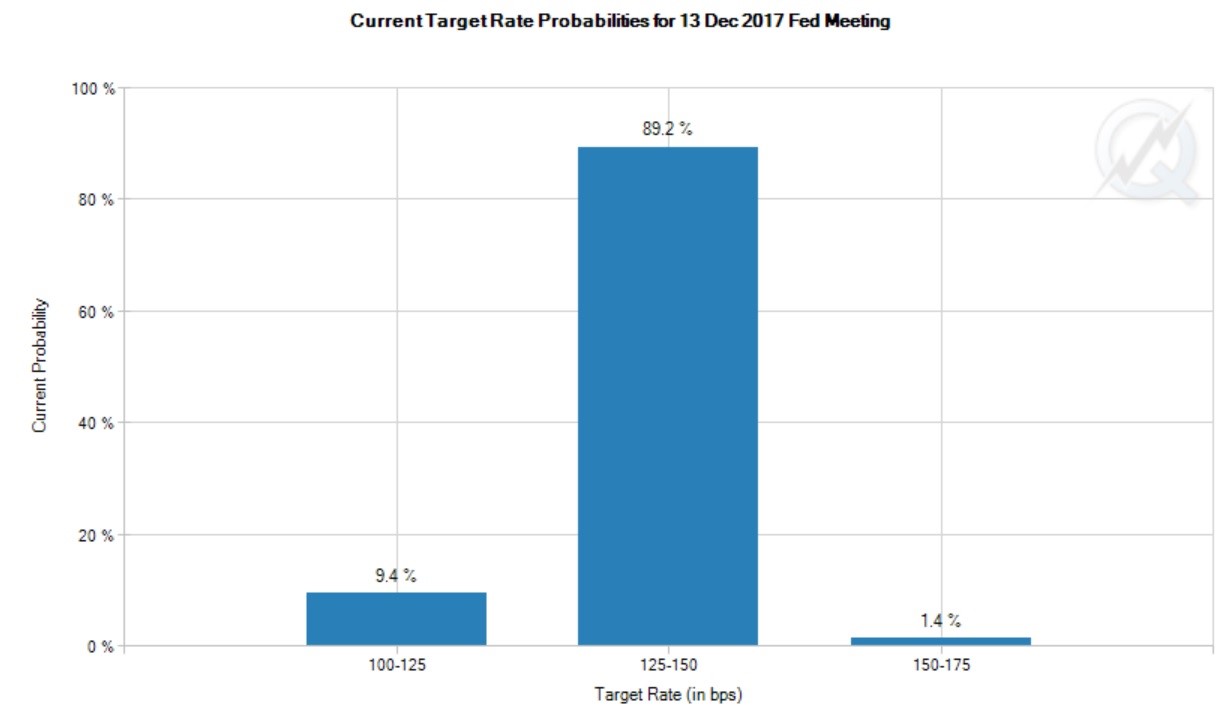
As I mentioned before, the market only looked at the good numbers and ignored the bad ones. This scenario played out with the odds for the next Fed rate hike in December. The CPI will likely beat expectations in September. Even though this is all temporary, the market doesn’t care. As you can see from the chart below, the December rate hike is now locked in. The chance of a rate hike increased from 82.7% to 90.6%. There’s even a 1.4% chance of 2 rate hikes. I could see that probability near 10% after the great CPI report from September. This doesn’t mean there’s any realistic chance of two rate hikes, but it shows how the Fed funds futures are pricing the relative hawkishness from the Fed. It’s interesting to see the hawkish expectations increase just as President Trump might pick Warsh. This would be a great transition because Warsh is hawkish. Warsh is now at a 41% chance of being picked and Yellen has fallen to 10%.
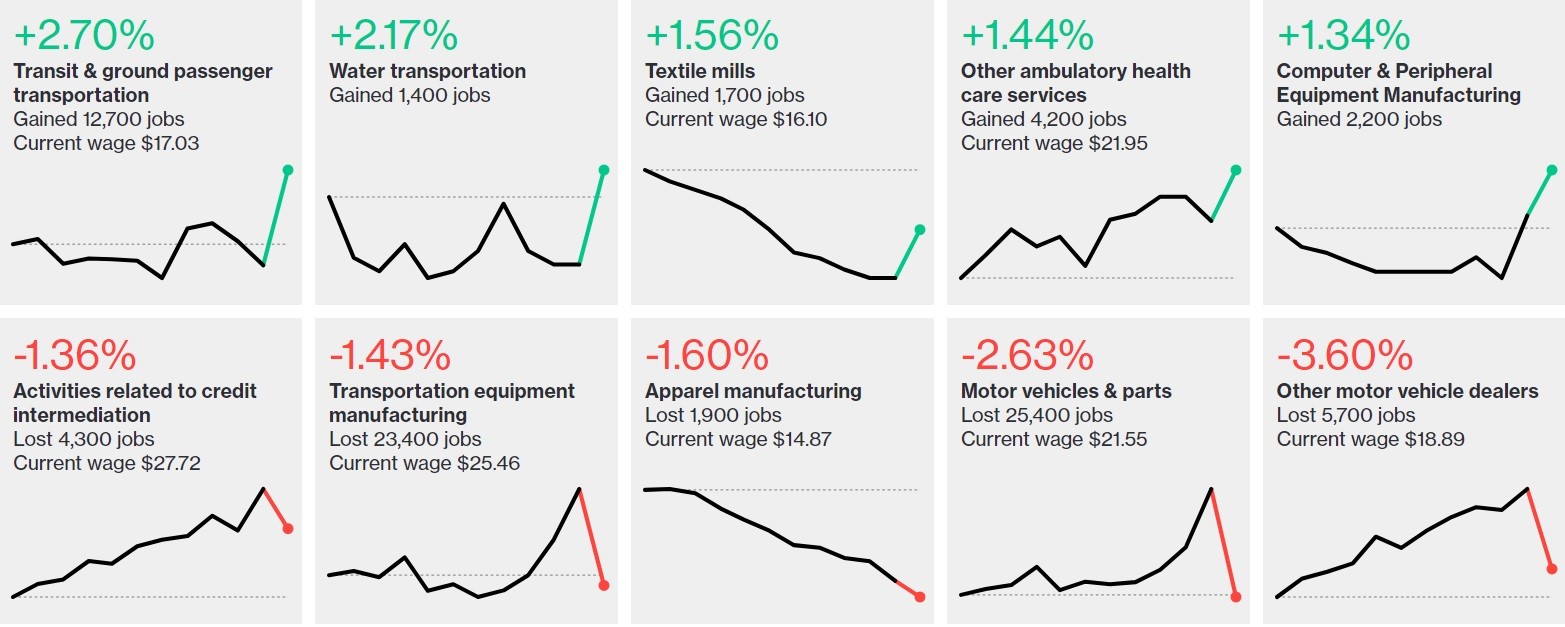
Now let’s look at the industries which had the biggest changes in both directions. As you can see, the best sector was transit & ground passenger transportation and the worst was other motor vehicles dealers. There may have been a gain in transportation jobs to deal with the challenges of meeting demand created by the storm. The auto sector either had a bad month because of previous weakness or because the storms prevented people from being hired in the places where the cars needed to be sold which means the influx of demand didn’t help the labor force. You can see there are many trend changes in all the charts. They are likely unsustainable because the storms were one off events. However, the strength in ambulatory health care services and the weakness in apparel manufacturing will likely continue because they are long term trends.
Conclusion
The jobs report was weaker than most economists expected. It was only strong in the wage growth category because the storm prevented people from being available in the areas that needed to hire more workers to rebuild from the devastation the hurricanes caused. Just like how the unemployment rate had a weird 0.2% decline despite the fact that there were 33,000 jobs lost, the stock market had a weird reaction to the report in that there wasn’t a selloff. Even though the market ignored all the bad results, it still acknowledged the wage growth as a reason to increase the odds of a December rate hike.