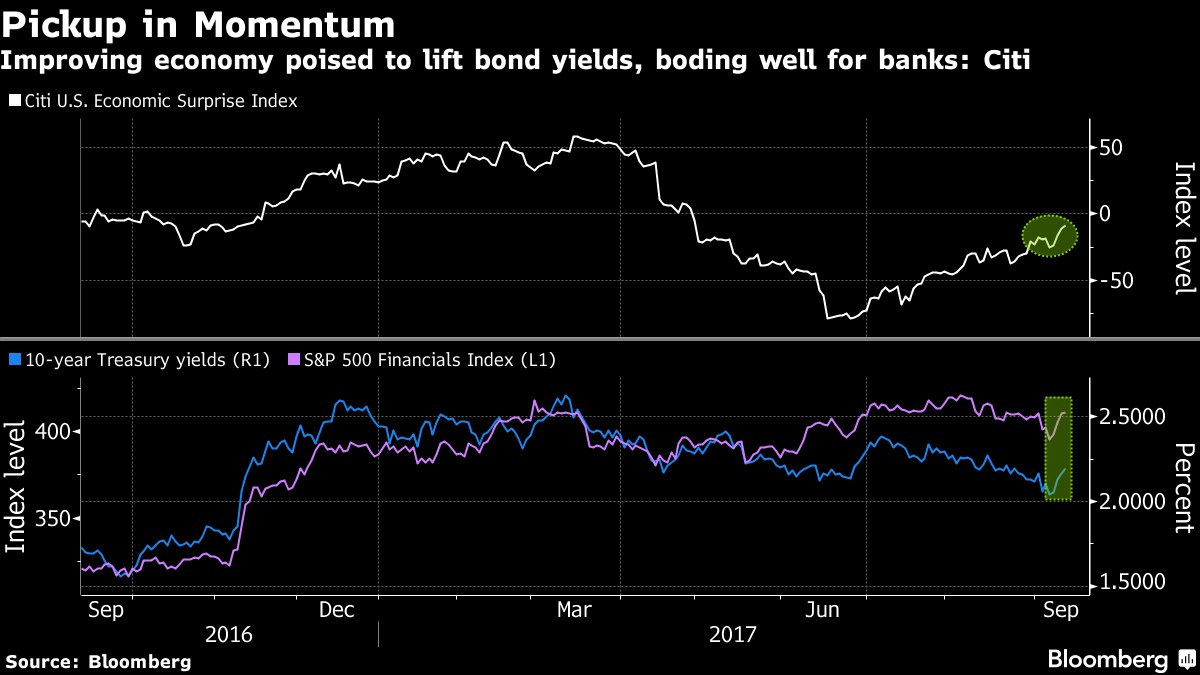
The Citi Surprise index has rallied back to near 0. Keep this in mind when you hear bears claiming the Citi Surprise index is doing badly. It’s a terrible economic indicator as the economy was strong in the first half, especially in Q2 where GDP growth was 3.0%. As you can see from the second chart, financials and bond yields have been rising. I disagree with the premise of this chart which is that the economy is improving which is pushing yields and banks higher. The reason yields have moved up gets back at the point I made in the last article; inflation has increased. As I mentioned, I expect the inflation report to be strong in September, but then it might weaken afterwards as future indicators are point towards economic weakness.
One of the economic reports which does matter is the jobless claims report which was released Thursday. It remains one of the only reports which shows the effects of the hurricanes. This is a preview as to how the economic data will look like in the next few weeks. I expect the September jobs report, which comes out October 6th, to show a negative headline print. This is also a preview of what jobless claims need to be for a negative print. That will help forecasts when there’s a recession instead of a temporary event. The jobless claims were 284,000 which was a 14,000 dip from last week. It was much lower than the estimate for 300,000. This number isn’t a perfect representation of the actual effect of Hurricane Irma because the results from Florida, Georgia, South Carolina, and the U.S. Virgin Islands were estimated because Labor Department offices were closed.
The Labor Department said the results were affected by both hurricanes. We won’t know the full effect from hurricane Irma until next week’s report. This report was from the week that ended September 9th. Hurricane Irma made landfall on September 10th which explains why the claims declined. I expect volatility in the number next week since the results won’t be estimated and will be effected by Irma. This will give us an estimate of the impact of Irma compared to Harvey. The Texas and Florida labor markets account for 14% of total U.S. employment. That gives support for my expectation of a negative September NFP print.
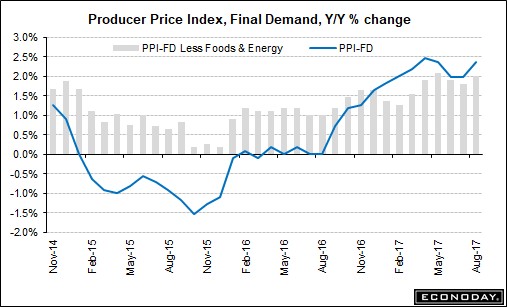
As I mentioned earlier, treasury bond yields have been increasing in the past few days. The CPI was released Thursday, so that couldn’t have been responsible for the increase a few days earlier. One of the reports which helped the increasing inflation narrative is the PPI-Final Demand report which was released on Wednesday. As you can see from the chart below, there was a moderate increase in year over year inflation. The year over year change was 2.4% which was up from July which had a 1.9% increase. The month over month increase was 0.2% which is up from the 0.1% decline last month. Excluding food and energy inflation was 0.1% month over month, up from -0.1%. It was up 2.0% year over year which was up from 1.8% last month.
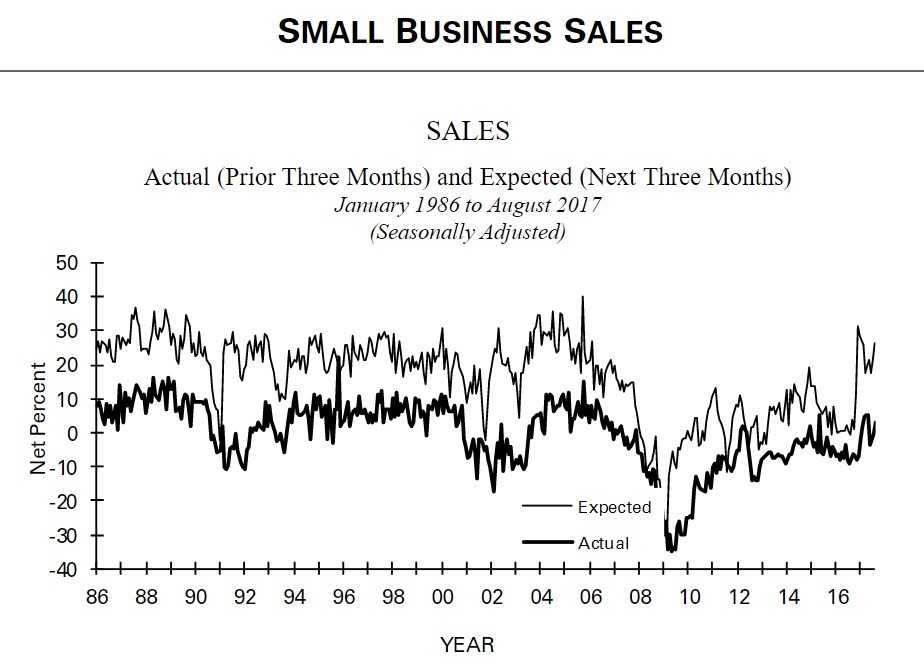
Let’s look at some of the rest of the results from the small business survey. As you can see, much like the small cap firms, revenues are expanding for small businesses. Actual sales changes, which is the number of businesses with higher sales minus those who had lower sales, were +3. That’s one of the best results in the past few years and 2 points off the peak for the year. The sales expectations index for the next 3 months was +27. That’s the 3rd best report since 2012, with the best being +31 in December 2016. This shows that the initial optimism after the election was accurate in predicting future sales growth.
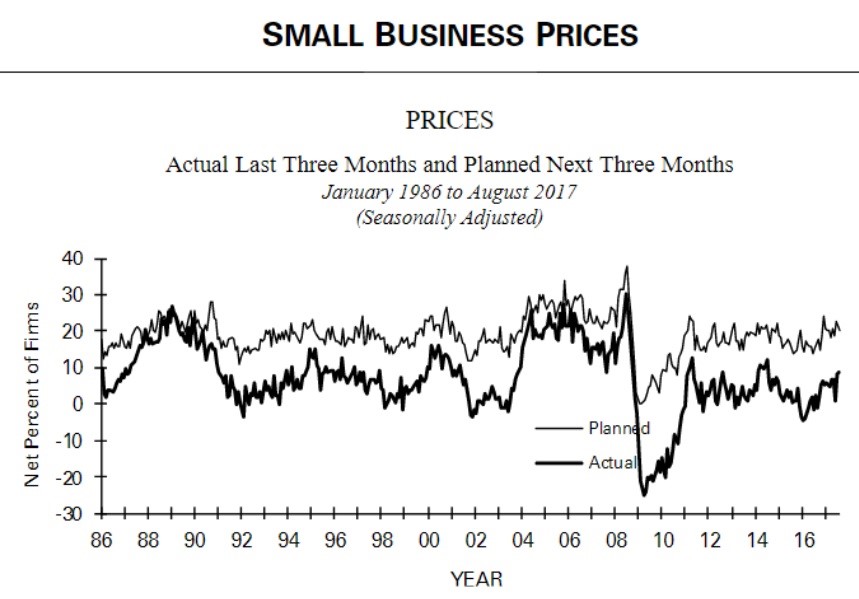
This next chart reviews the inflation pressures on small businesses. These results are consistent with the acceleration of inflation seen in the producer price index. As you can see, the actual price change index was +9. That’s the highest since July 2014. The price plans index was +20 which was down 3 points from last month. This future index was 22 in July 2014. These reports and the PPI show the slight increase in inflation that occurred in August.
Bitcoin Mania
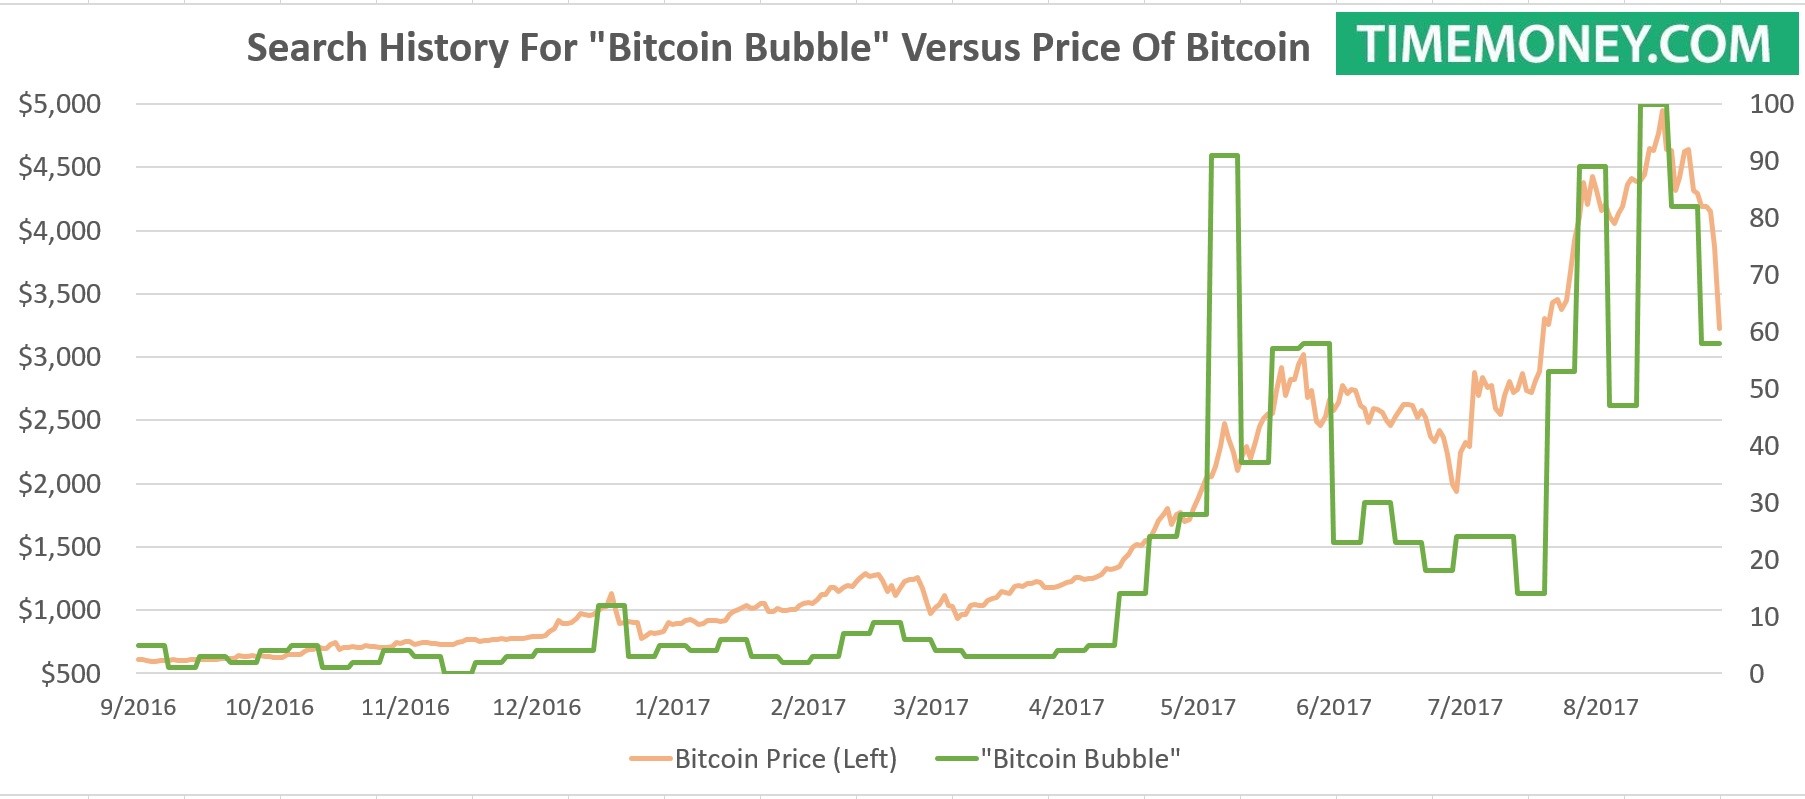
While the volatility is nonexistent in U.S. equities, there is extreme volatility in Bitcoin as you can see from the chart below. The cryptocurrency has fallen over 30% in the past few days. The searches for “Bitcoin Bubble” have fallen since it’s no longer as frothy. Besides the negative comments from Jamie Dimon sending it down, the other negative catalyst was BTC China immediately stopping accepting new account registrations on its exchange. 23% of Bitcoin trades come from China. The country has had a volatile stance on Bitcoin which rivals the vacillations in the price. Recently ICOs were banned, but that is expected to be temporary. It’s a catch-22 scenario because the higher Bitcoin goes, the more China will crack down on it, which sends it lower. The other aspect in play with this decline in Bitcoin is that it may just be a profit taking selloff since it has risen exponentially this year. Anytime the cryptocurrency falls by over 20%, I think it’s a good time to dip your toe in the water.
North Korea
The futures market for stocks fell on Thursday night because of the latest threat by North Korea. This time the belligerent country sent another ballistic missile over Japan. This is the second missile sent over Japan and into the Pacific Ocean in the past month. It passed over Hokkaido, Japan, which is in northern Japan. The good news in this horrific circumstance is President Trump and the President of China appear to be working in concert to squeeze North Korea economically. The stock market shouldn’t sell off that hard on this latest news event.