As expected, the annual GDP growth rate came in between the NY Fed and Atlanta Fed’s projection as it was 2.6%. This was above my expectation for 2.25% growth and slightly below the consensus estimate which was 2.8%. I don’t consider this to be a weak report just because of the slight miss as anything above 2% growth is great. It would be silly to focus on tenths of a percentage point because this is only an advanced estimate. This report tells us that Q2 GDP growth will be between 1.4% and 3.8%. When you look at it that way, the report doesn’t tell us much other than the economy improved its growth rate from Q1. The worst part of the report was that Q1 GDP was revised lower to 1.2% growth which means the average growth rate in the first half of the year, as of the latest stats, is 1.9%. The report led to a 0.073 basis point flattening in the yield curve. This might reflect the weakness in risk assets partially due to Amazon stock’s weakness more than the GDP report because it was close to expectations.
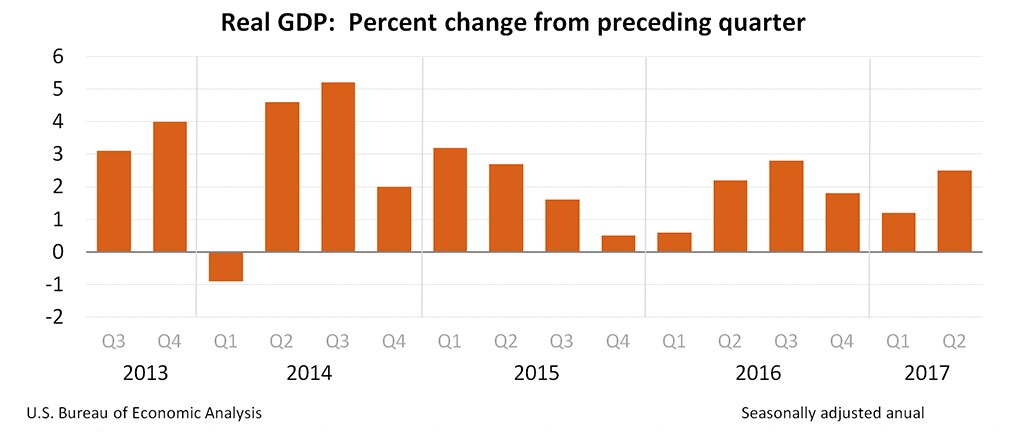
Before we delve into the Q2 report, let’s look at how the BLS revised the 3 previous years of data. 2016’s GDP growth was revised down one tenth to 1.5%; 2015’s GDP growth was revised higher three tenths to 2.9%; and 2014’s GDP growth was revised higher by two tenths to 2.6%. In relation to the past 3 years, the 1.9% pace the economy is on now isn’t that great and isn’t reflecting the solid earnings growth. That’s mainly because of the sharp divergence in Q1 because of energy earnings improvement and international earnings improvements. The weakness in 2016 catalyzed global QE. That’s an interesting metric to keep in mind in 2018 and 2019. If U.S. GDP growth falls to about 1.5%, expect the central bankers to discuss ending the tapering/unwind.
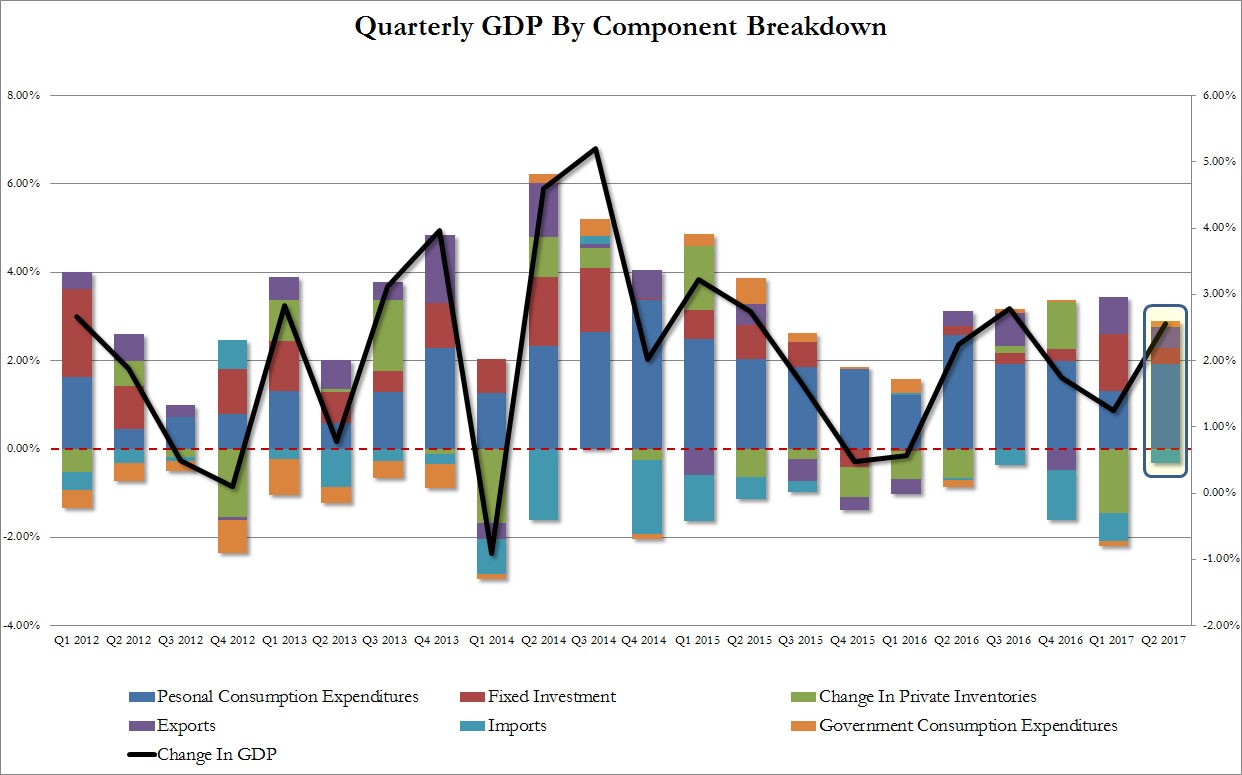
The chart below breaks down the GDP growth component. The biggest reason for why GDP growth was good was the personal consumption expenditures index rose by 2.8%. With the increases in tax withholdings because of the strong labor market, it’s not surprising to see consumer spending doing well. That’s why labor market indicators have a high correlation to the overall economy. As you can see, exports fixed investment, inventories, and government spending were all positive factors for GDP. The only drag was imports which is usually the case. A strong consumer and no drags is the recipe for a solid report. It will be interesting to see what happens when the tax cuts are enacted in 2018. That is the only way I foresee a 3% growth handle being achieved.
The personal savings rate in Q2 fell one tenth to 3.8% from last quarter. That comes out to Q2 savings being $546.8 billion which was down from $553 billion. It’s weird to see the savings rate decline considering the increases in earnings. That might be caused by changes in interest rates, spending habits, and the effect from student loans and other debts.
The most confusing part of this entire report was that personal income increased $118.9 billion which was almost half the growth in Q1 which was $217.6 billion. The reasons for this decline were weakness in wages & salaries, government benefits, rental income, non-farm proprietors’ income, farmers’ proprietors’ income, and personal interest income. These declines were slightly offset by an increase in personal dividend income. While these numbers will be changed when they are revised, I am confused how there was such a sharp decline in income growth despite the improvement in PCE and tax withholdings. This seemingly nonsensical number might be caused by seasonality adjustments gone awry. Economists have tried to boost seasonally adjusted Q1 GDP because it has been consistently low. Even with the adjustment, the annualized growth was 1.2%. Maybe they boosted personal income growth too much.
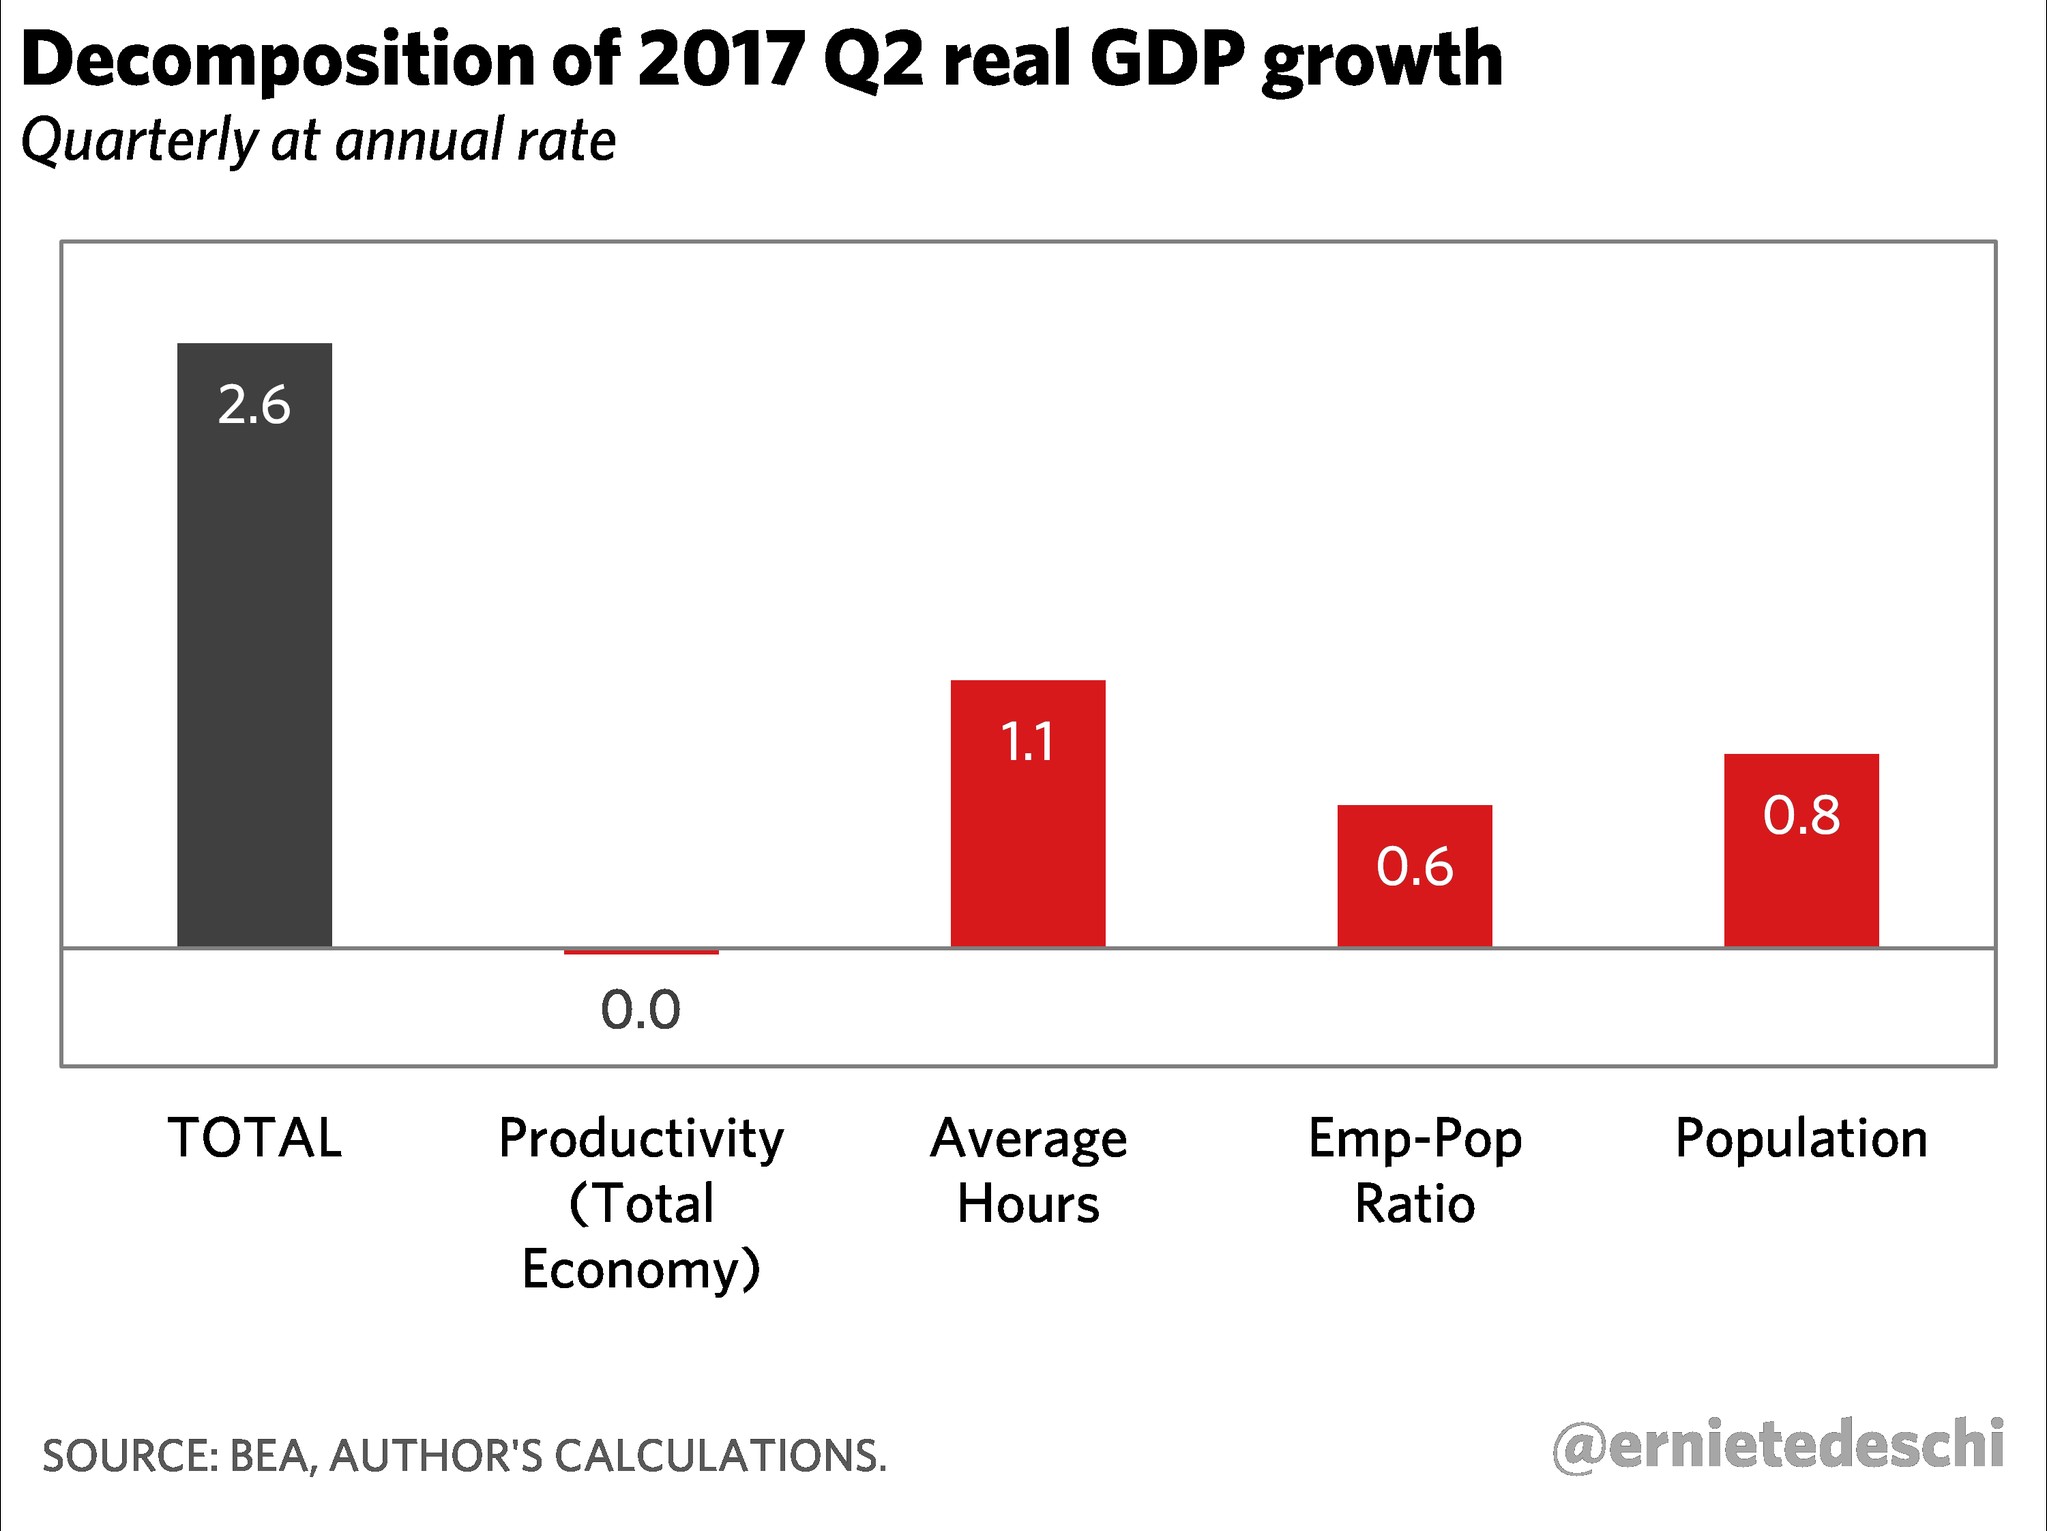
The chart below is probably the most shocking part of the GDP report. As you can see, the employment to population ratio, population growth, and average hours worked drove GDP growth. There was 0% productivity growth, yet again. It’s possible that this low interest rate environment is hurting productivity growth. I expect the full-year GDP growth to almost always stay below 3% because of the deceleration in population growth. However, if productivity growth got back to where it was before the financial crisis, 3% growth would be attainable.
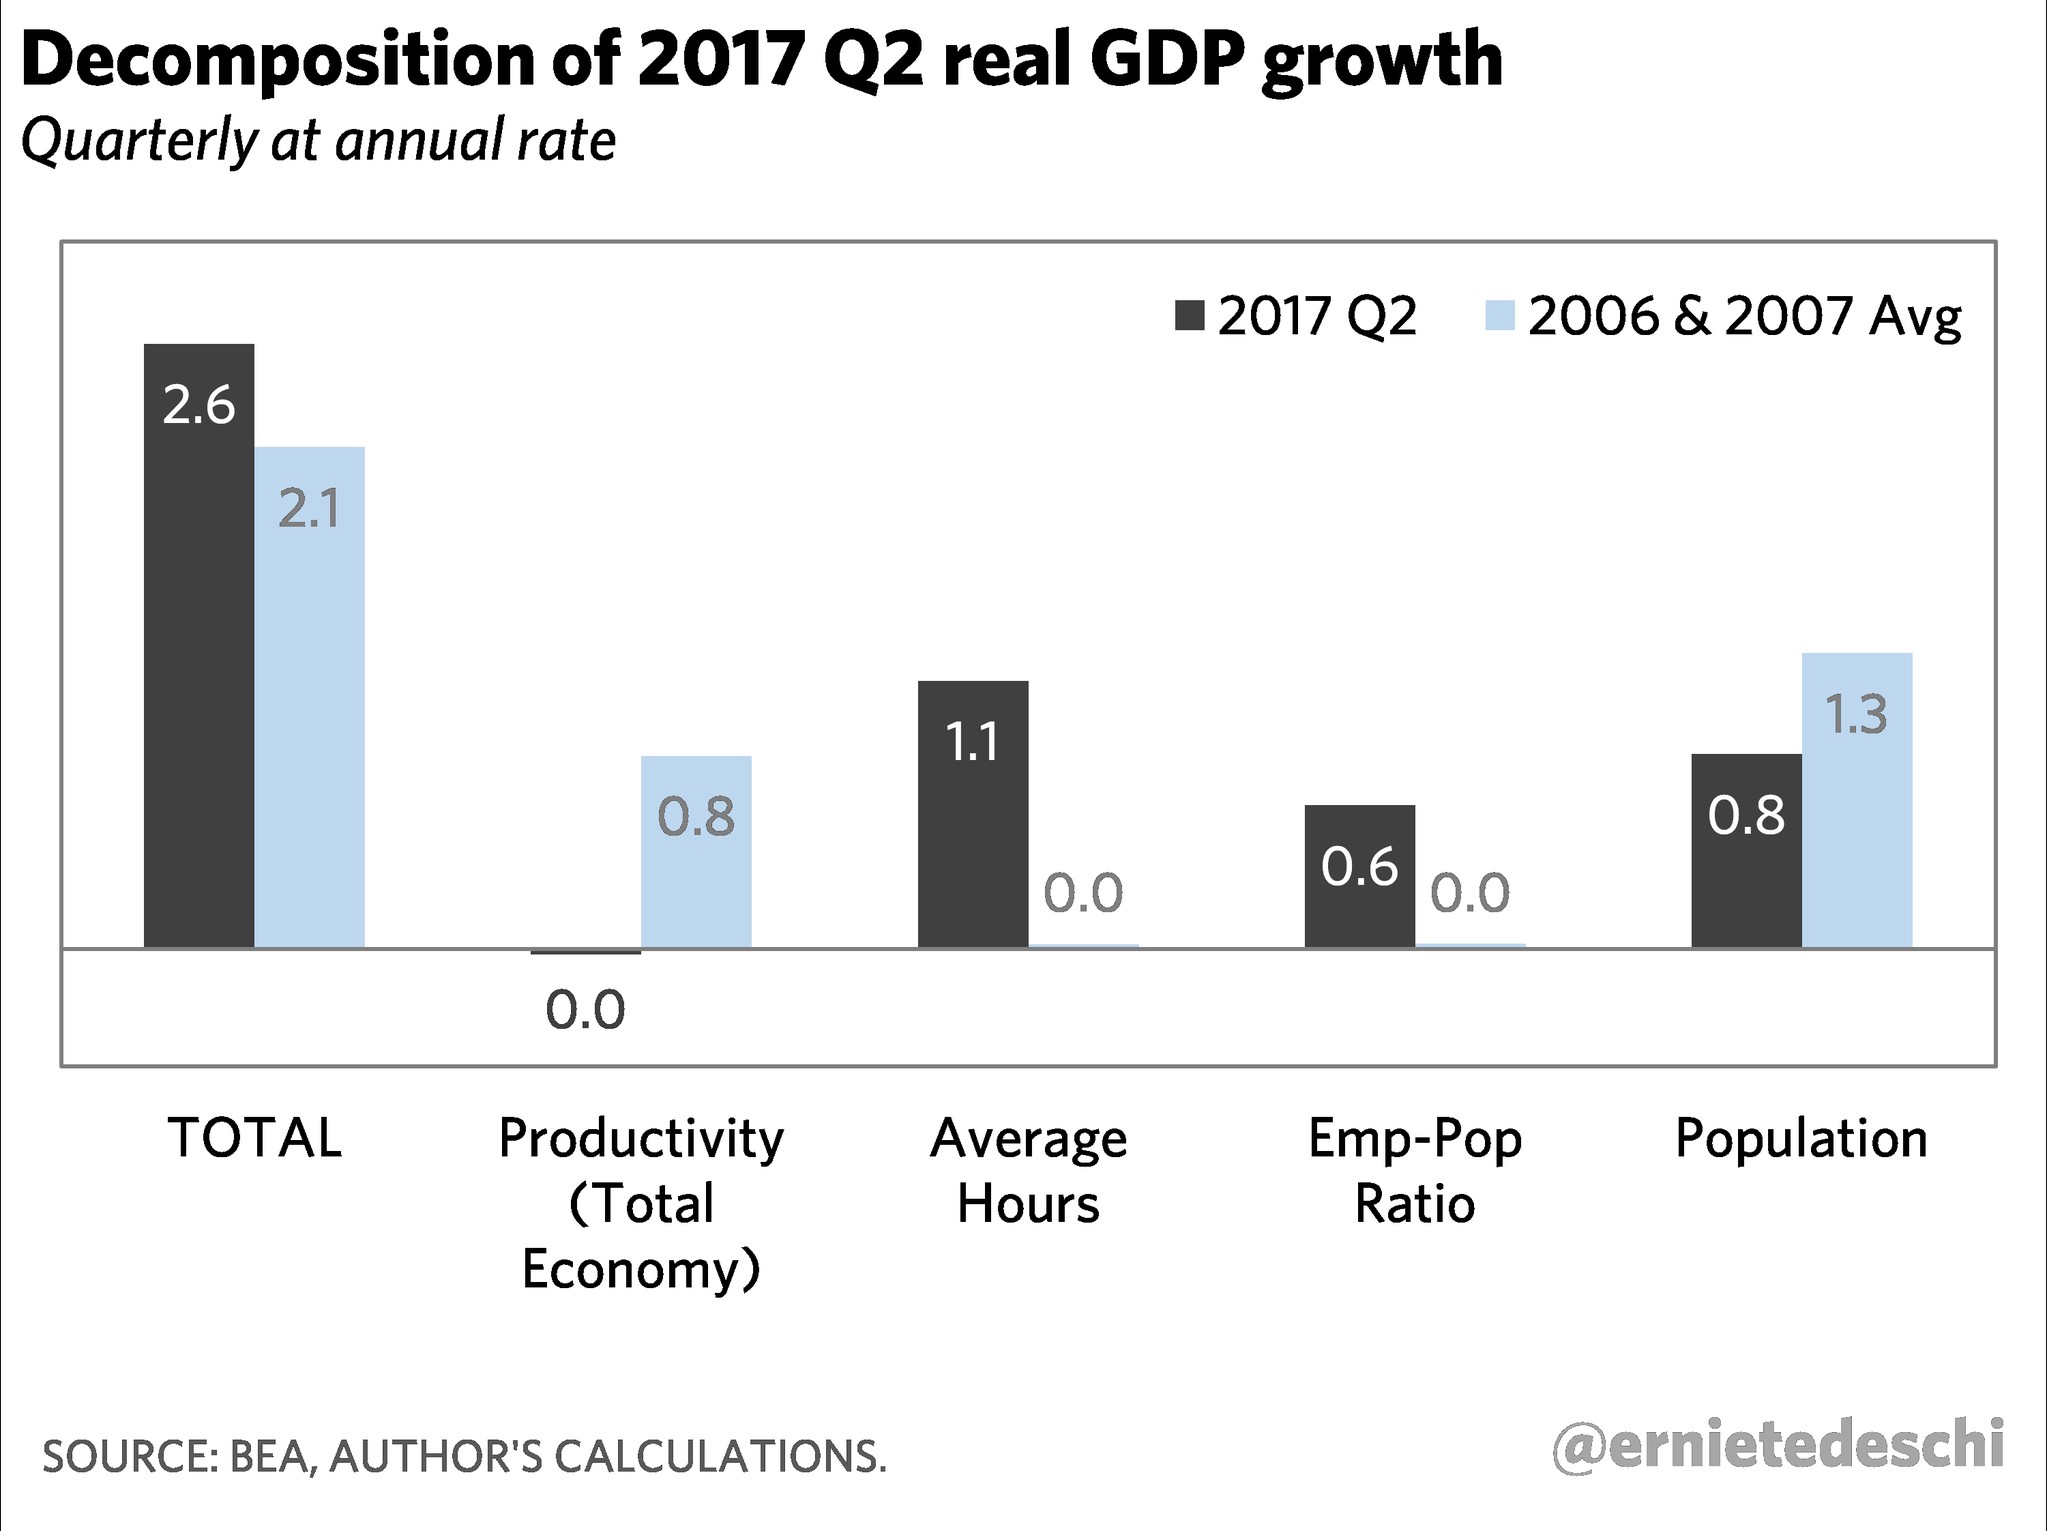
The chart below shows how the population growth has decelerated from 1.3% to 0.8% in the past decade. If productivity growth were to get back to the 0.8% growth seen in 2006 and 2007, the economy would be firing on all cylinders. Besides low interest rates, the other possible explanations for weak productivity growth are increased regulations and central bank asset buying. We’ll see the answer to what is causing productivity growth to fall next year because of the central bank unwind and the deregulation President Trump has been promising. There can’t be real improvement to living standards without productivity growth. This should be more of a priority for policy makers than it is. That’s because the Fed is focused on inflation and wage growth and politicians like to focus on headline numbers to support their agenda, which is mainly getting re-elected.
Conclusion
The GDP report was within the range most economists expected which is great news as there was a sharp rebound from Q1 led by the improvement in consumer spending. The initial expectations for Q2 from 3 months ago weren’t met, but they were always unrealistic. The market is more concerned with earnings growth expectations. The economic reports simply must stay in line with where they have been and stocks will move higher. The 1.9% growth in the first half was only slightly faster than the growth rate in 2016, yet stocks have moved up double digits. The key is to avoid a recession. Despite the 1.2% growth in Q1, the recession fears didn’t gain steam like they did in late 2015 and early 2016
1 Comment
Scott Baker
July 30, 2017Have you compared the of the overall US money supply to see if there is a correlation between the amount of money going into the market and especially the FAANG stocks versus historical records? Could this correlation, if it exists, demonstrate that an unusually high amount of money, compared to the money supply and past history, have increased the risk for these stocks or others. I wonder if all the low interest money from Quantative Easting has been placed into the stock market, versus other vehicles and in doing so, totally changed the characteristic of the stock market.