The weekly Bloomberg Consumer Comfort index was released Thursday morning. It fell from 51.2 to 49.9. This was the first decline in 4 weeks. Confidence among Republicans decreased, while it increased among Democrats. This shows the partisan differences are disintegrating. This makes sense because now that the election is over, the questions can be answered based on how people are doing. The index is likely more accurate now than it was right after the election. The index is still relatively high which makes sense because the labor market is relatively strong, the stock market is as strong as it can be, and home values are increasing.
The State of the Economy index increased from 44.2 to 45.3. Confidence from full time workers is the highest since early April which is consistent with the 3.5% wage growth shown in the Atlanta Fed’s wage growth tracker. The confidence of those earning $15,000 or less made a 6-week high, but fell for those making more than $100,000 per year. Usually I like to see the middle class doing well because they collectively have high spending power. However, looking at the rich versus the poor, I’d rather see the rich optimistic. That being said, the minimal changes in both categories aren’t strong indicators either way. The Personal Finance index fell from 63.0 to 60.4. You’d expect this indicator to be increasing with the increases in the stock market. It might be being dragged down by increased delinquencies from credit cards and auto loans. Another problem for consumers is that rent costs are the highest percentage of GDP ever.
The charts below show interesting points about the apartment market. As you can see in the chart on the left, the number of apartment units under construction have skyrocketed since 2010. This makes sense because some of the homeowners who defaulted on their loans during the financial crisis had to move into apartments. The entire philosophy on home ownership has changed among millennials. Millennials have large student loans which prevents them from buying a house. They also witnessed the collapse first hand and don’t want to participate in another one. Home ownership rate in Q1 2017 was 63.6%, effectively eliminating all the growth seen during the housing bubble. The chart shows that the growth in apartment buildings in 2007 didn’t even reach the peak seen in 1986 because many potential renters jumped into housing as loans were given to anyone with a pulse in the early 2000s.
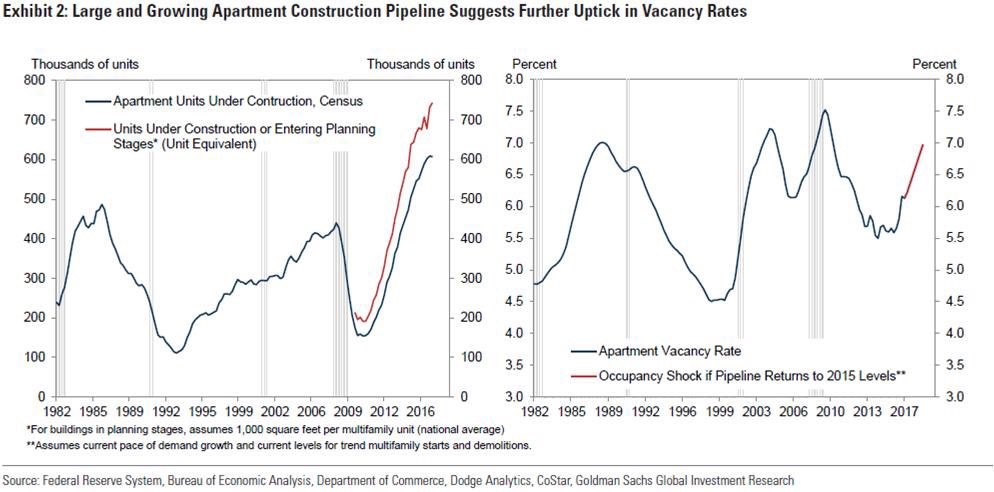
The apartments created in the past few years made up for the low rates of building growth in the previous cycle. The chart on the left, shows apartment vacancy rates. It’s not surprising to see vacancies increasing because of how high rents have gotten. The increased vacancy rates will cause prices to decline which will be problematic for all the new apartments which are about to be built in the next few quarters. Obviously, any economic weakness would increase vacancy rates. As you can see, even without a recession vacancies are expected to increase in the next few months. At least during a recession, rent costs will moderate. That will be great for those who still have their job, but won’t be good for those who lose their job.
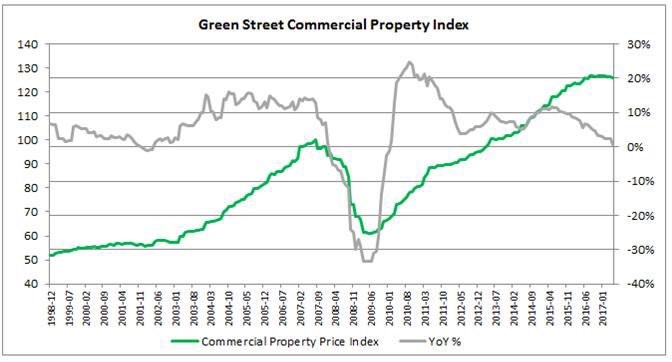
Vacancy rates aren’t just problematic for apartment buildings. As you can see from the chart below, the Green Street Commercial Property Index is starting to roll over. The year over year change in property prices is now flat. It’s amazing to see the index falling when corporate profits are so high for the S&P 500. This is one of those scary charts which makes it look like a recession is right around the corner. In rate of change terms, obviously negative numbers come after zero.
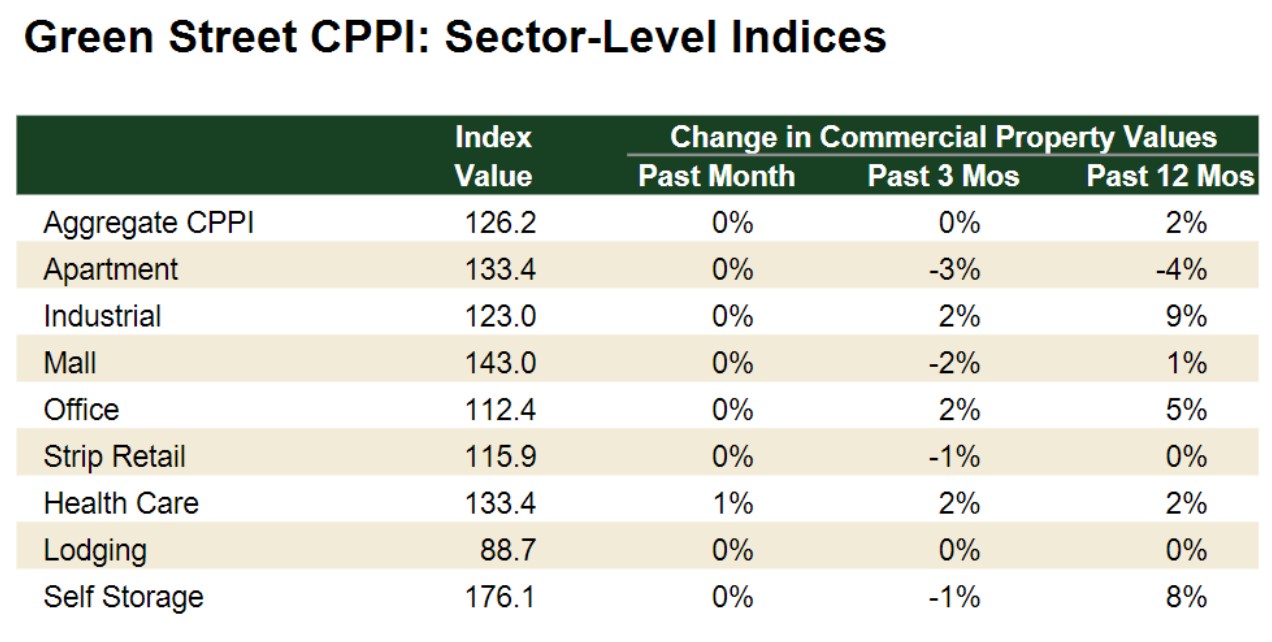
The chart below breaks down the historical changes in commercial real estate prices by the various sectors. Only healthcare saw a price change in the past month. Keep in mind, the aggregate CPPI index doesn’t include the healthcare, lodging, or storage industries. The latest weakness is stemming from apartment buildings which have seen a 4% decline in prices in the past 12 months. This is consistent with the increase in vacancies discussed earlier. Even though wages have increased lately, rent expenses have increased more. This problem is finally starting to impact vacancies.
It’s interesting to see how well malls are doing considering how the news is consistently reporting on the death of malls. Property values for malls are only down 2% in the past 3 months. The malls have moved their reliance on apparel and general merchandising to restaurants and other attractions which are experiences. It makes sense that malls would thrive on something you must be there to experience. One example of an experience would be malls integrating movie theaters. There are some movie theaters which offer restaurant style food as movies theaters increase their attractiveness because they’re feeling the heat from Netflix.
I think the biggest bubble is in the self-storage market. As you can see from the chart below, it has risen at an accelerated clip this cycle. The public storage stocks have risen like tech stocks in this bull market. Their bold innovation is empty warehouses to store people’s junk. It’s not as technologically intensive as cloud computing! Public Storage stock ($PSA) seems to be anticipating a peak in this industry as the stock is down 23.45% since April 1st, 2016.
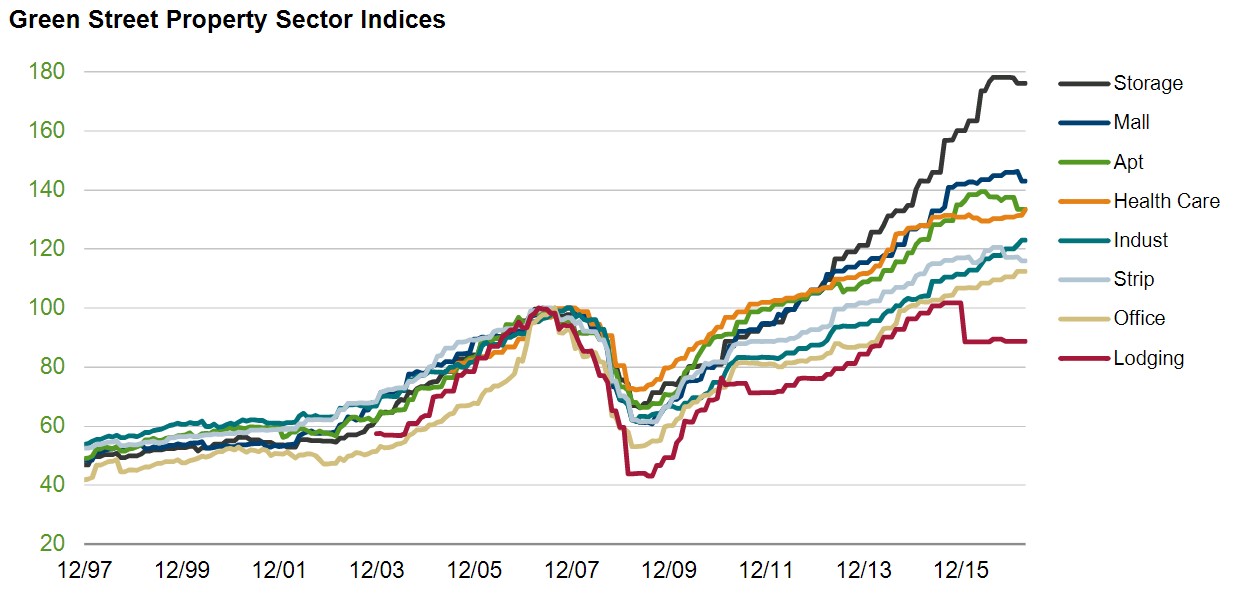
Office space might be the category which is the most impacted by corporate profit growth as its growth slowed in 2015 and is now picking up. The slowness isn’t that noticeable likely because the small fracking firms which went bankrupt in 2015 and 2016 likely didn’t have much office space compared to the financials. The big energy firms which lost money probably didn’t make major changes to office space. The industrials category is growing the fastest with 9% year over year growth. This is a very healthy signal for future economic growth. It’s important to recognize that the chart’s scale makes it look like the industries have decoupled more recently, but that’s not true. They will likely all fall in the next recession, with self-storage taking the hardest hit.