The NY Fed updated the household debt statistics reflecting Q1 numbers. The total household debt reached a new record high. Total debt rose $149 billion to $12.73 trillion which is $50 billion higher than the previous record high in Q3 2008. There’s two things to keep in mind when reviewing this headline metric.
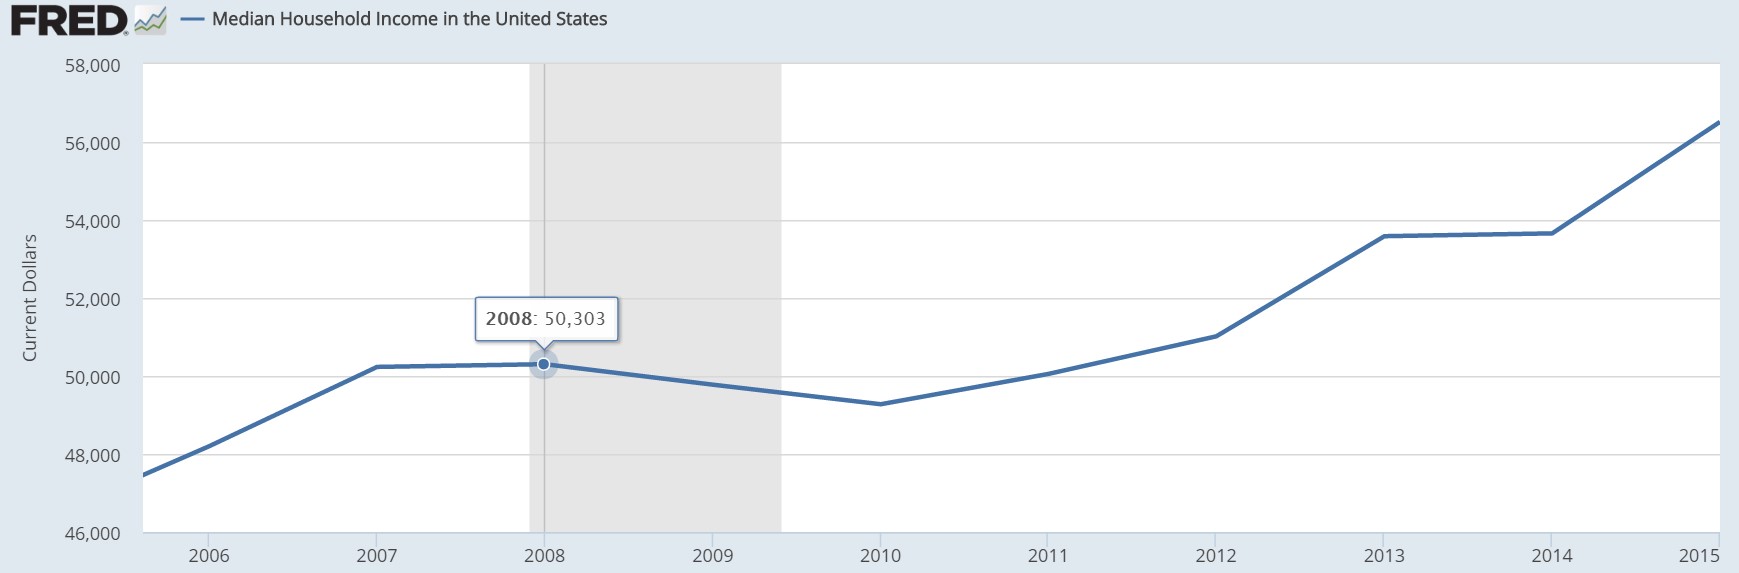
The first is that this is in nominal terms. It’s not surprised that the debt has risen higher than the 2008 peak because there’s been inflation and economic growth since then. While real wage growth has been stagnant for much of this recovery, nominal wages and income have grown. As you can see in the chart below, median household income was $50,303 in 2008. The latest information from FRED is from 2015. In 2015, median household income was $56,516. Nominal wage growth in 2016 was 2.5%, so I’ll estimate the median household income was $57,929. This means income growth was about 15% since 2008. Household debt being flat while income grew 15% makes the scenario look less dire.
The other thing to keep in mind with the household debt, which you can see in the chart below, is that the peak debt level in Q3 was inflated because of the recession. Debt increased as median incomes fell and the unemployment rate rose. In the next recession, medium incomes might fall again and the total debt will increase. Median incomes fell about 2% from 2008 to 2010. In the year leading up to the peak in debt in Q3 2008, the debt increased 4.4%. Overlapping this timeline on the current economy, if a recession starts next quarter, the debt will peak 4.4% higher than its at now and incomes will fall by 2% from 2018-2020. As you can tell, the further away the next recession is, the bigger the problem will be. That’s why I’ve been saying if the global central banks would have let the economy fall into a recession in Q1 2016, there could have been a nice deleveraging. The higher the debt gets in the next few quarters, the more likely there will be a nasty deleveraging.
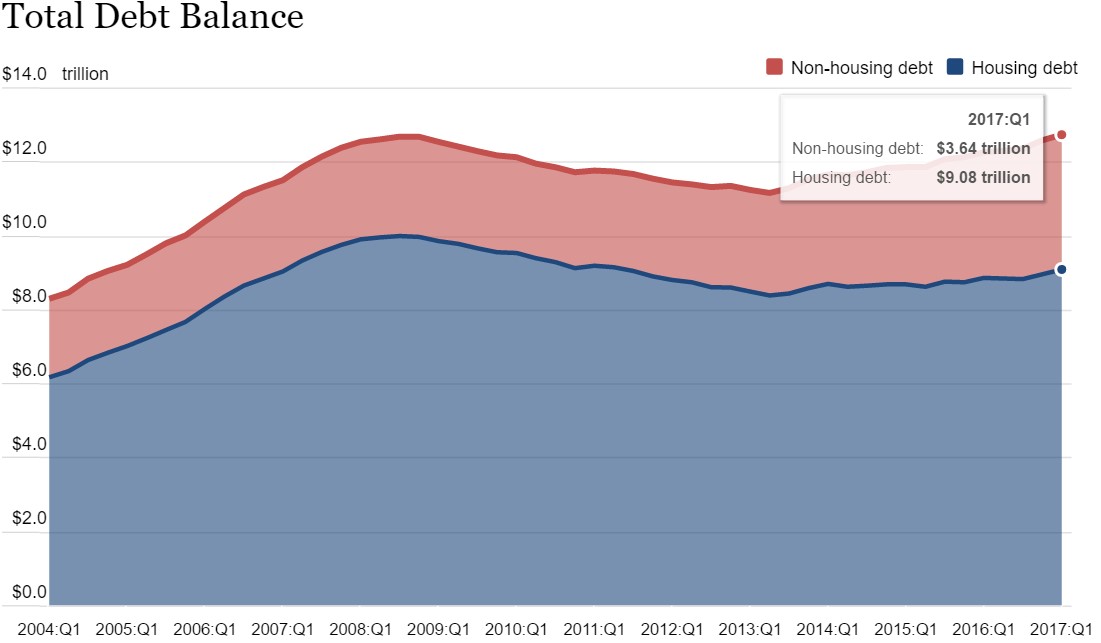
As you can see from the chart above, the non-housing debt has expanded much faster than the housing debt. Non-housing debt peaked at $2.71 trillion in Q4 2008. The current non-housing debt is $3.64 trillion which is a 34.3% increase. As you can tell, that’s about double the growth rate of median household incomes. This is while mortgage debt hasn’t moved much. In Q3 2008, it peaked at $9.99 trillion and now it’s only at $9.08 trillion.
It may not be fair to compare the current debt bubble to the previous one because credit card debt, auto loans, and student loans are much smaller than housing debt. While they are smaller, they are also more toxic because the collateral is smaller as a percentage of the loan. Student loans are backed by nothing because a degree can’t be seized. Credit card debt is also backed by nothing because the assets acquired with the debt often lose most of their value. Automobiles lose their value after they are driven out of the lot, but at least they’re backed by a depreciating car/truck. Housing was much more reasonable because mortgages are backed by a house. It’s arguable that because the debt is of lower quality, a smaller bubble can be worse.
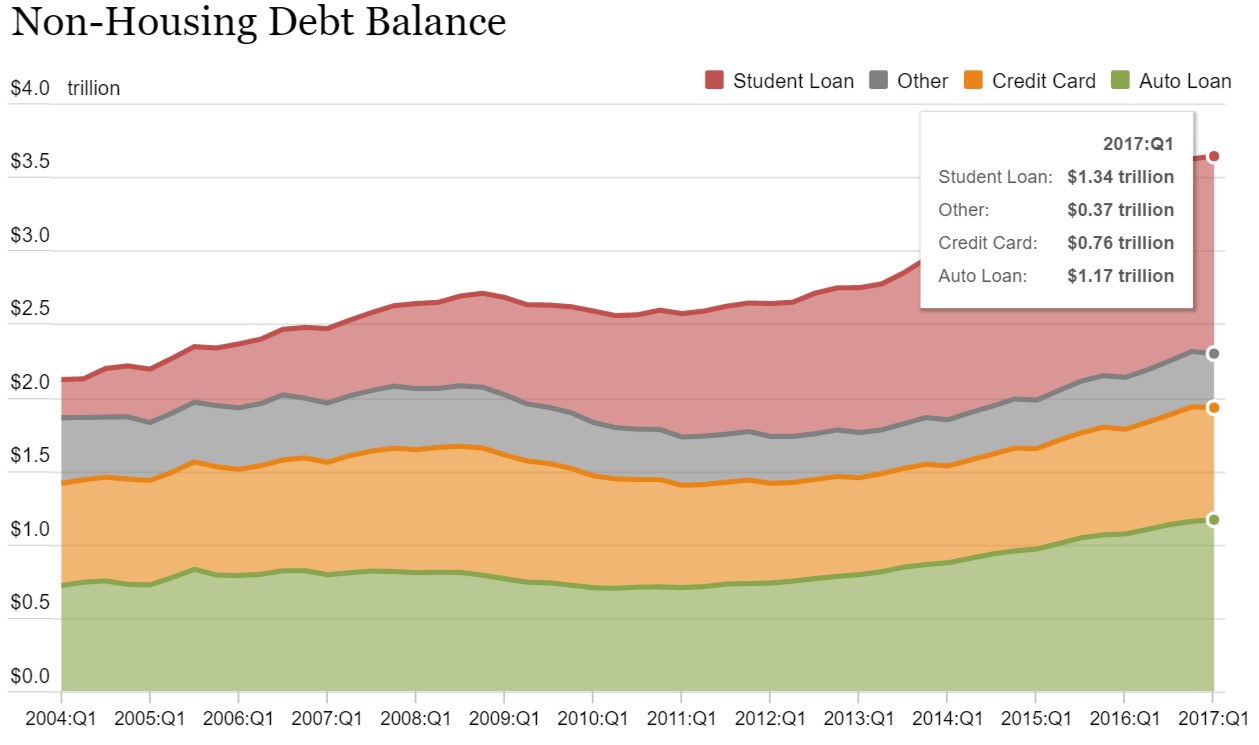
The chart below breaks down the non-housing debt. Quarter over quarter student loans increased 2.6%, auto loans increased 0.9%, and credit card debt fell 1.9%. Student loans have increased every year in the past 18 years since it started being tracked by the NY Fed. This makes sense because kids still need to go to college during recessions. This part of the problem with student loans. There aren’t proper standards which have been set up to make sure that only those who are likely to pay off the loan are given money.
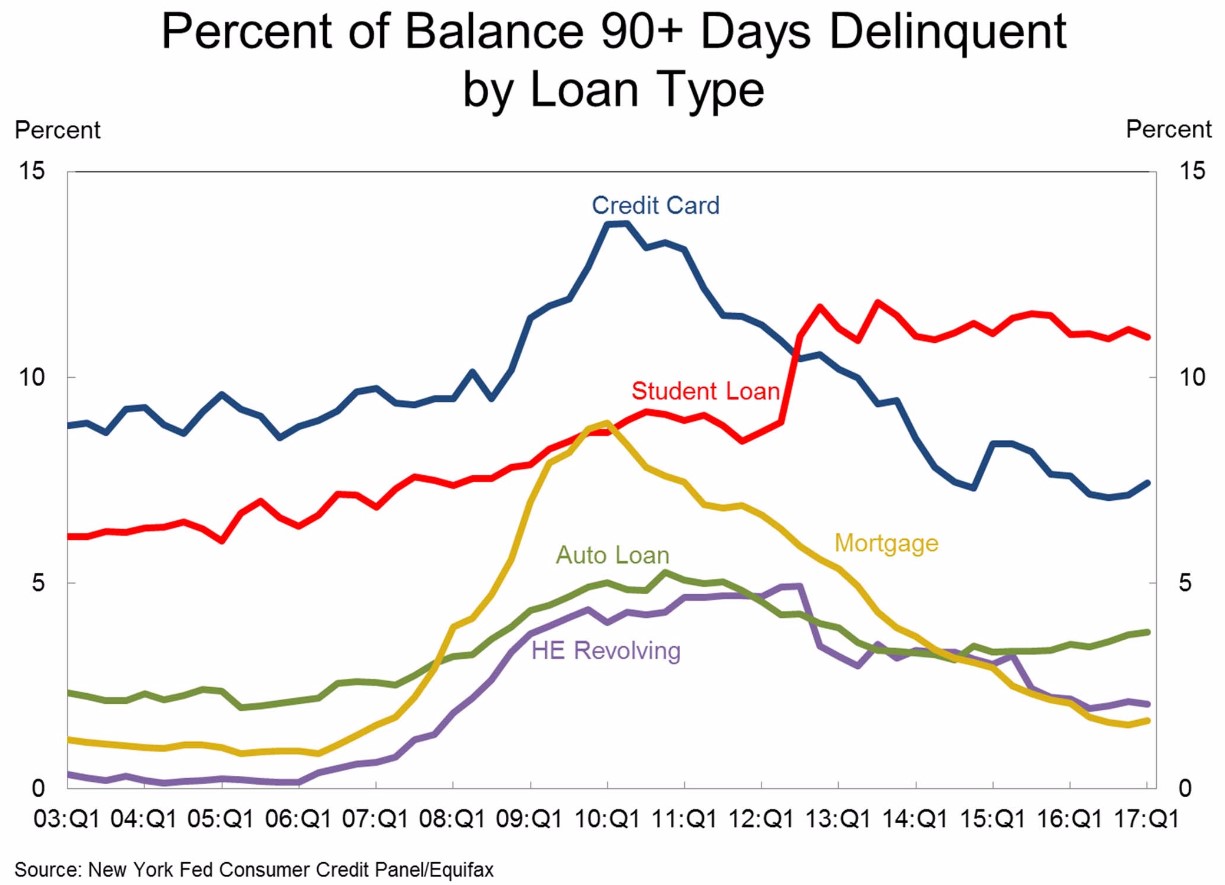
Proof that the proper standards haven’t been put in place for student loans can be seen in the delinquency chart shown below. Student loan delinquencies have been hovering around 11% since 2013. This isn’t a cyclical issue because the other types of loans have seen their delinquency rates fall in the past few years. The high delinquency rate is caused by the price of college and the lack of standards. These two problems are caused by government guaranteed loans. This is a case of good intentions leading to bad results.
President Trump has discussed forgiving loans after 15 years of paying them off based on a percentage of income. This plan would not solve the problem. It would encourage students to borrow even more money and to get a low paying job for the first 15 years after college. While you may think that everyone would want to be paid as much as possible, the math could switch in the favor of getting a lower paying job if the loans are large enough and the difference in the jobs’ pay is small. The real problem is the cost of college; the only way to solve this problem is to let private industry take control of the student loan market. It would be tough at first because some kids wouldn’t be able to go to college and interest rates on loans would be higher. However, colleges would respond to the decrease in demand by lowering prices. This would solve the problem.
Textbook costs have risen at almost the same rate as tuition. This is because the demand is inelastic and there’s only a few textbook companies. If students didn’t have unlimited amount of loans to go to college, textbook prices would also come down. Furthermore, students would flock to colleges which decided to go with cheaper textbooks to cut the total cost of college down. There are many industries only controlled by a few companies. What sets the textbook market apart from them is the government guaranteed loans.
Conclusion
The household debt in relation to median income is not as high as it was in the 2008 financial crisis, but the debt is of lower quality because student loans and credit card debt aren’t backed by collateral. This is part of the reason why their delinquency rates rise above the rate mortgages went sour at during the peak of the housing crisis. Student loan debt already has a high delinquency rate. Imagine how bad it will get when the labor market weakens.