The stock market action has almost been nonexistent in the past few weeks. There has been many important economic reports and political stories swirling, but the movement has become minuscule. The movement is so small, it’s probably the biggest story of the year. There’s quite a few shocking charts I will show in this article which capture the lack of movement.
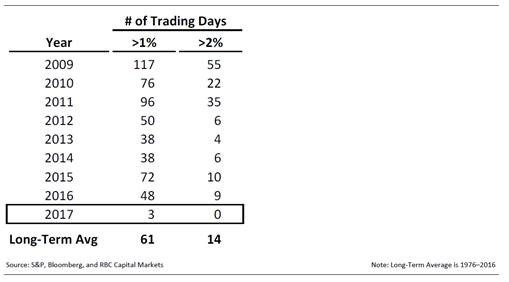
The first chart shows the number of trading days where the stock market has moved more than 1% and the number of trading days where the market has moved more than 2%. As you can see, 2009 was extremely volatile as the stock market bottomed on March 9th. The final flush down and the initial bounce higher is captured in this chart as there were 55 trading days with a greater than 2% move. 2009, 2010, and 2011 were all above the long-term average. The market settled down since then with volatility slightly perking up in 2015 as the number of 1% moves was slightly above average. With about 4.5 months in the books, the stat line for 2017 is shocking. There have been only 3 days where the S&P 500 has moved more than 1%. That’s a pace of 8 for the year. That’s 13% of the average. There have been zero days with more than 2% movement as nothing has shaken the market.
It’s tough to come up with a catalyst for future volatility because nothing has phased the market. Normally, I’d say rate hikes might catalyze a selloff, but the March rate hike didn’t do anything and the June rate hike has been priced in without any added volatility. The current chance of a rate hike in June 73.8%. There will be FOMC members speaking on Thursday and Friday which will give more clarity as to what decision will be made. Judging by the Fed’s rhetoric, interest rates will be raised. Judging based on the CPI deceleration, interest rates will be held steady.
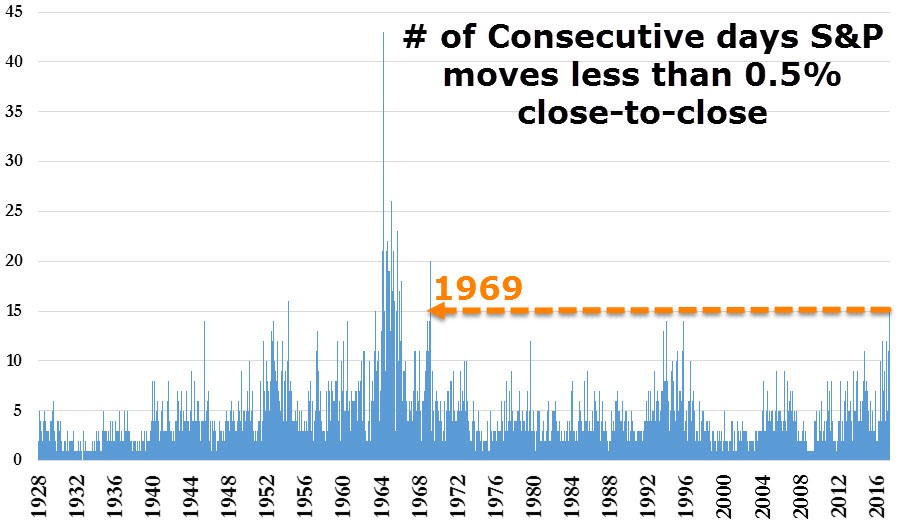
The chart below is an updated one of the chart from Monday. It shows that the current S&P 500 15-day streak of no movement greater than 0.5% is the longest since 1969. As you can see, the record streak is 43 days. This signal on its own is mostly meaningless because no impending doom happened after the streaks in the 1960s and the 1990s. In fact, the mid-1990s were the early innings of the greatest bull market ever. The reason it’s worrisome now is because it’s possible the volatility suppression has been created artificially by the central banks expanding their balance sheets. One point worth noting about the chart below is that the S&P 500 was started in 1957. Before that it was called the Composite index and it had less than 500 stocks.
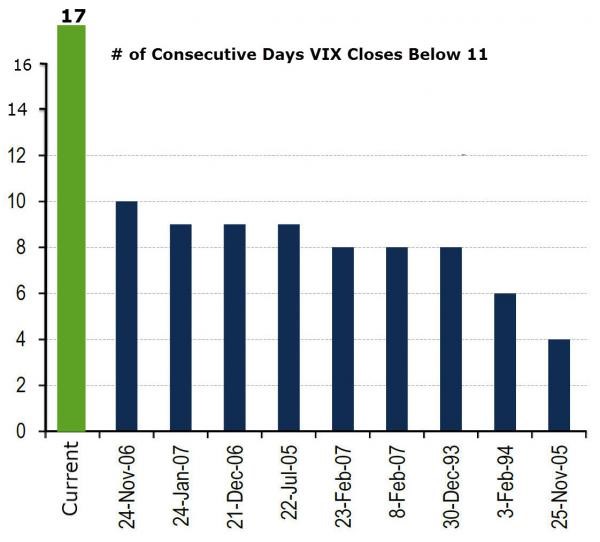
The final chart showing the extraordinarily low volatility can be seen below. The current streak of the VIX closing below 11 has reached 17 days which is 70% longer than the previous record. The VIX was started in 1993. I’d expect this record to have been higher if there was more data. The other streaks in this chart are from before the financial crisis, but I wouldn’t draw conclusions from that. The reason risk is high is because of high leverage, not because the VIX is low. I’m showing these charts because of how unusual the action has been, not because they have predictive value.
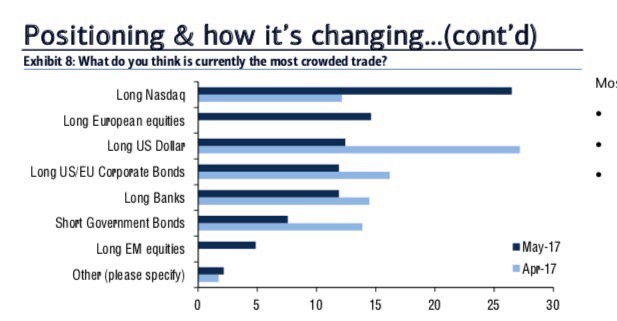
The best index on Tuesday was the Nasdaq which rose 0.33%. It’s now up 14.62% year to date which is sparking fears of a bubble. As you can see from the chart below, the long Nasdaq trade is considered to be the most crowded trade according to the Bank of America Merrill Lynch fund survey. This survey has a great track record lately. As you can see in the chart, in April the long dollar trade was considered to be the most crowded trade. The dollar has cratered since then. On April 3rd, the dollar index was at $100.49. It’s currently at $98.07. The Nasdaq is driven by the big tech names which are driving the other major indices higher (besides the Russell 2000). If the big tech names fell and drove the Nasdaq down, the other indices would fall. To be clear, these firms are Apple, Alphabet, Microsoft, Amazon, and Facebook.
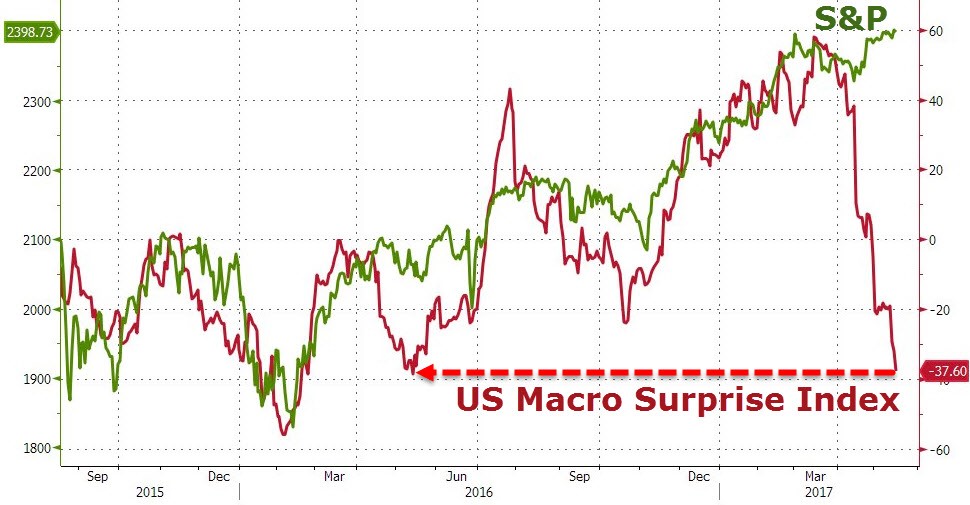
The latest survey data is continuing the negative trend which I’ve discussed previously. The Citi Macro Surprise index has cratered to -37.60. Even though I have been predicting this decline, it’s surprising to see the speed at which it has happened. The chart below seems to insinuate that the stock market is too high because the S&P 500 has diverged from the surprise index. It’s worth pointing out that the S&P 500 bottom earnings are near their record high while the bottom up earnings were in a recession in early 2016. The weak Citi Surprise index in April of last year didn’t correctly forecast the subsequent increase in bottom up earnings. That’s not to say that the divergence in the soft data and the S&P 500 isn’t significant. It’s something to watch, but it doesn’t mean the S&P 500 is likely to crash soon.
Conclusion
I’m usually hesitant to discuss quirky moves in the market, but the latest action has been record breaking, so it’s worthy of discussion. My perspective is that there isn’t any catalyst that will send stocks crashing lower in the near-term. The bulls have great support for their arguments because earnings in Q1 were strong. The weak data points may signal Q2 earnings won’t be as great, but until earnings season comes along in 2 months, I don’t see it bothering the market. Even if estimates come down, the trailing twelve-month bottom up earnings will reach a new record this year. While I’m skeptical of the Q2 GDP forecast of above 3% growth, I can’t come up with specific arguments to combat the forecast because so little of the data is out.
The argument against being bullish on the Nasdaq is that the top tech names are expensive. It’s tough see that driving them lower because they’ve always been expensive. I’ve been operating on the assumption that their earnings would have to miss expectations for their stocks to fall. Since they all have reported already, that won’t be driving them lower in the next 2 months.
1 Comment
Scott Baker
May 21, 2017Could there be some collusion with the market makers to keep the stock prices artificially high and stable? The stability seems to be artificial as no one seems to be upset about anything in the world today. The Italian and Greek debt crisis is overlooked and the declining spending of the baby boomers does not seem to be of any impact. As an investor and person, I find it very scary. We have seen the financial sector ignore evidence to the determent of the common man and it appears to me that it happening again.