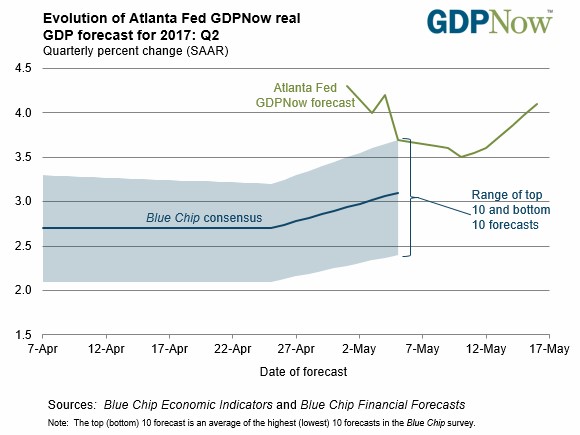
The estimate for Q1 GDP by the Atlanta Fed’s Nowcast increased from 3.6% to 4.1% as you can see in the chart below. One of the reasons for the increase was the solid industrial production report released on Tuesday. It caused the forecast for real final sales to private domestic purchasers growth to increase from 3.3% to 3.6%. While the GDP Now estimate is still far away from the blue-chip average, it’s worth noting that the blue-chip average estimate has increased from 2.7% to 3.1%. It’s rare for this recovery to have GDP estimates increase mid-quarter and it’s even more rare for growth to be above 3%. It’s not something which can occur consistently unless productivity growth improves. However, it should temporarily get above 3% after the tax cuts are put into action at some point in 2018.
As I said the industrial production report for April was surprisingly great especially after the weak Empire State Index report on Monday. Just because it doesn’t fit the trend doesn’t mean it should be ignored. Industrial production was up 0.96% month over month which was much better than the expectation for 0.4% growth. This is the fastest growth rate since February 2014. Factory production grew 1.0% after shrinking 0.4% in March and mining production increased 1.2% after decreasing 0.4% in March. Oil and gas drilling spending increased 9.0% as the American frackers continued to boost production even as oil fell to the $40s in April. They are hoping OPEC extents their production cuts.
There was an increase in durable goods spending which is a reversal from the weakness seen in Q1; weak durable goods spending growth was part of the reason for the weak GDP report. Oddly, there was an increase in advances for motor vehicles and parts. There was a 5.1% increase in automotive production. Without this burst, industrial production growth would have been 0.6%.
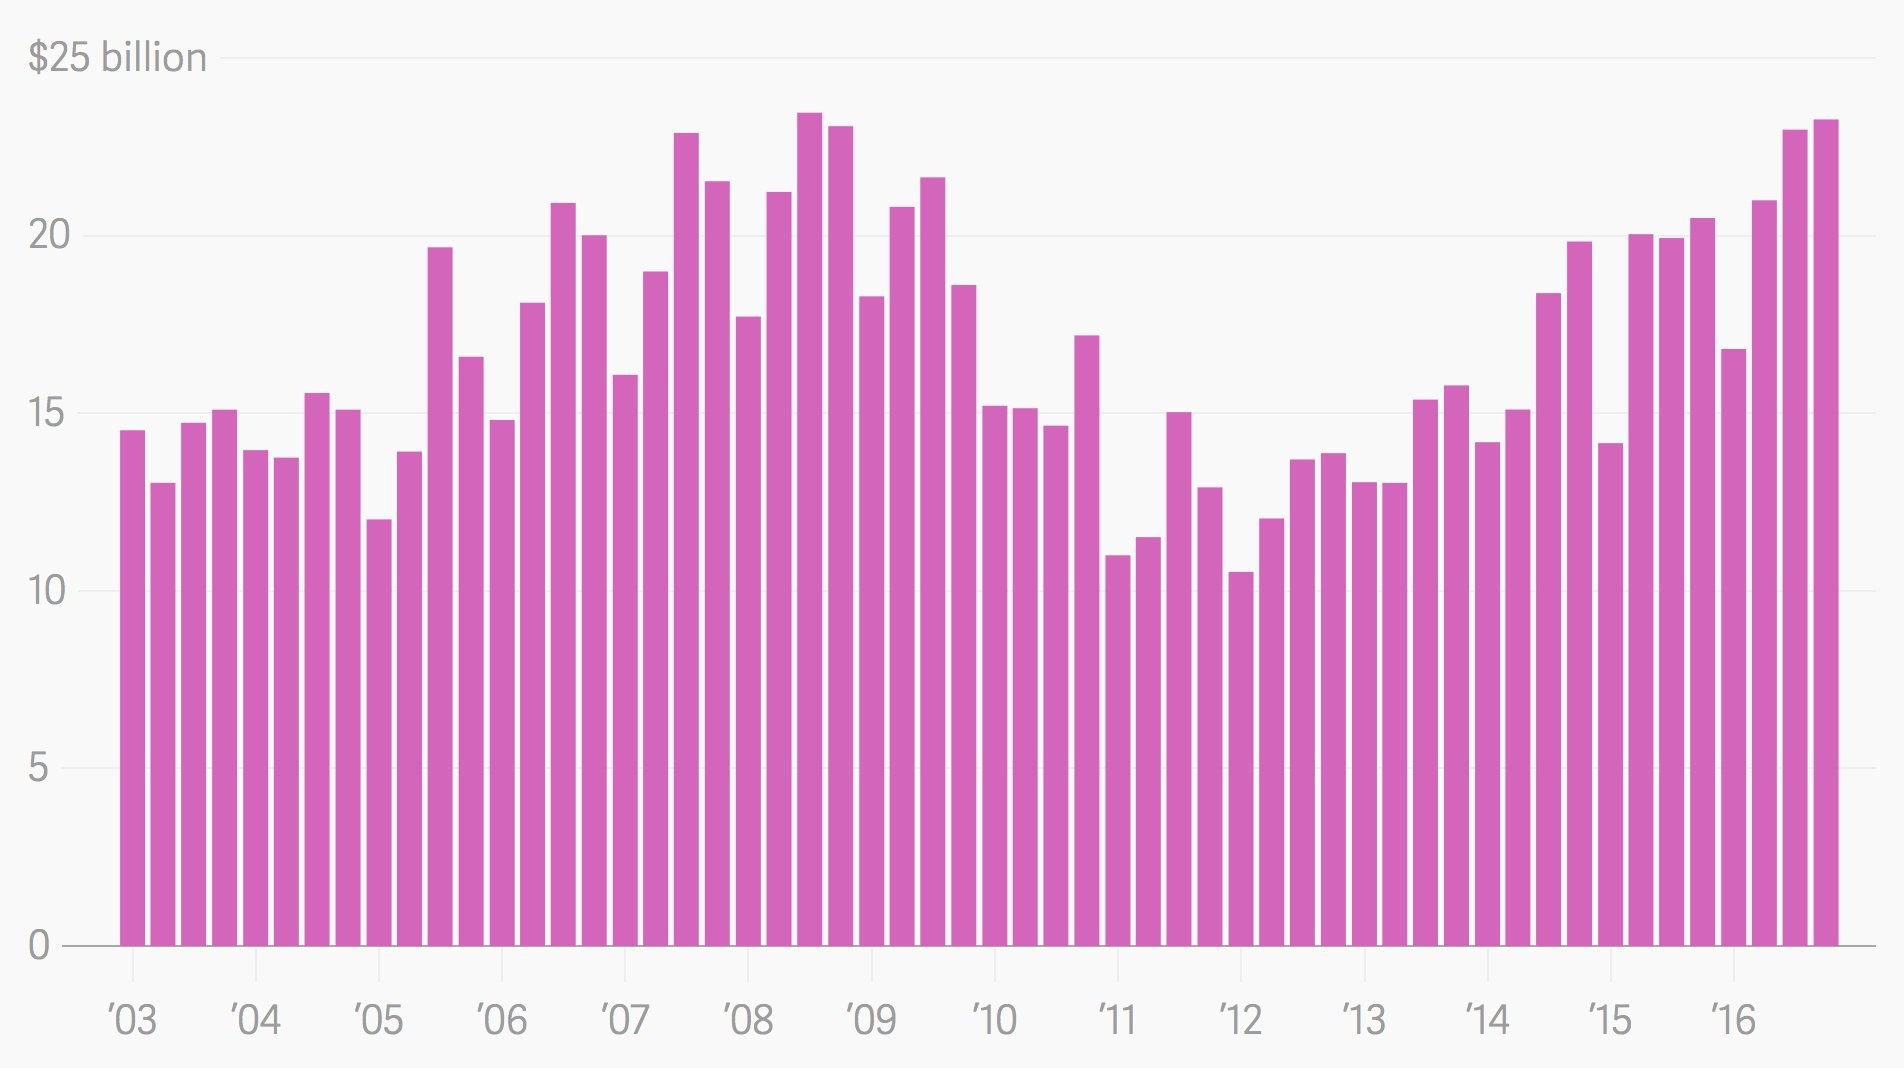
I think this boost in auto production doesn’t make sense because of the chart below. It shows the balance of newly delinquent auto loans. As you can see, the balance of newly delinquent auto loans is near the peak of the 2008 recession. If the current economy were to fall into a recession, the situation would get even more out of control. When auto loans are easy to get, it can temporarily boost consumption. At some point the lending becomes too generous which causes delinquencies to rise. When delinquencies rise, the auto lending becomes less generous which causes consumption to fall. The seasonally adjusted annual rate of auto sales has declined 4 straight months. If anything, producing more automobiles is a bad thing because those cars won’t be sold and they will have to be marked down.
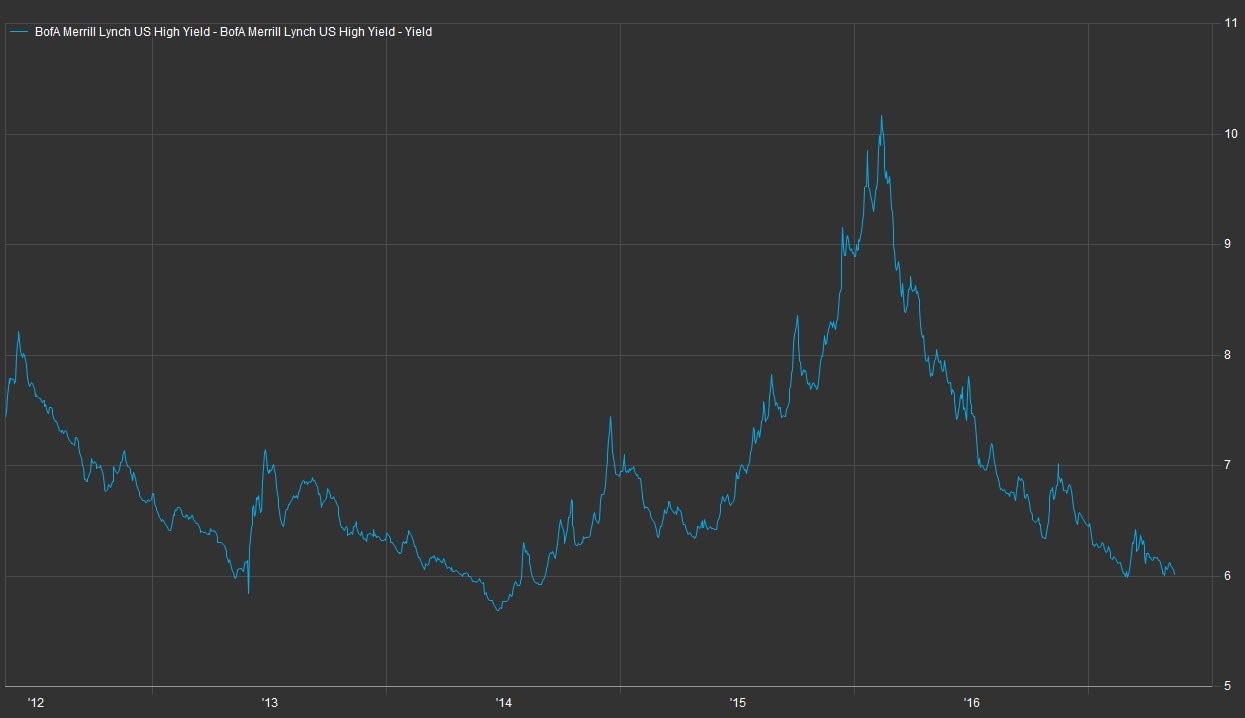
Giving out cheap auto loans and student loans to consumers who are already near holding the most debt ever makes little sense. They’re not the only ones getting cheap lending rates. As you can see in the chart below, the junk bond interest rate is at 6% which is only slightly above the lows seen in 2014. As earnings have rebounded to the 2014 highs, junk bonds have followed. The other aspect is oil prices have rebounded as energy and mining were the sectors that drove up default rates. Just like how I think margins are near their ceiling, I think junk bond yields are near their floor. The two are correlated as an increase in borrowing costs would decrease profits. It’s usually a bad idea to buy junk bonds when yields are low because default rates usually pick up soon afterwards just like what happened in 2014.
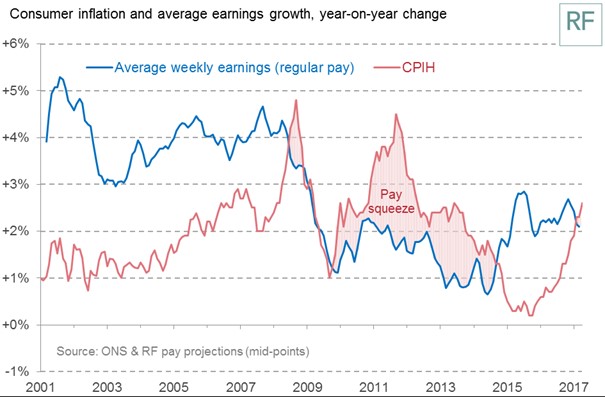
As I have mentioned extensively in prior articles, the consumer is being squeezed by inflation. There doesn’t need to be a high inflation rate for the consumer to get squeezed. All that needs to occur is for there to be a squeeze is inflation which is higher than hourly wage growth. The chart below captures that difference by comparing CPI per hour growth with the average hourly earnings growth. When the CPIH is above wage growth, the consumer is squeezed. The consumer has been squeezed for most of this recovery. The only respite was when oil prices crashed which almost caused a recession. With oil prices increasing in the past few quarters, the consumer is back to getting squeezed. That’s a problem because its debt is already near an all-time high.
As I mentioned in my article yesterday, some of the retailers which were expected to do well are reporting earnings this week. On Monday TJX reported. As you can see from the chart below, its report was weak. TJX was expected to have 1.6% same store sales growth, but the actual results showed 1.0% growth which is the weakest growth rate in 3 years. Adding to the weakness, guidance was only for 1%-2% growth in same store sales in Q2. This shows even the best operators are seeing weakness caused by online competion. It makes me wonder if the party is over for the brick and mortar retail firms who have been resistant to the growth of Amazon. It’s worth noting that Q1 was lapping a difficult comparison as same store sales growth was 7% in Q1 2017. A two year stack of 8% growth doesn’t sound nearly as dire. However, guidance for 1%-2% growth in Q2 2018 is disconcerting because Q2 2017 same store sales growth was only 4% meaning the two year stack would slump to 5.5%.

Conclusion
The biggest sore spot of the economic reports this year was Q1 GDP. Q2 GDP is expected to see a major rebound. I’m still not sold on that forecast because retail earnings have been weak which signals the consumption growth for Q2 likely won’t be robust. The heightened delinquency rate on auto loans makes me think the private domestic spending won’t grow as fast as implied by the strong industrial production report in April. One good report doesn’t mean the economy is turning around. The housing starts were down 2.6% in April and building permits fell 2.5% month over month, so not all hard data is strong.