The S&P 500 and Nasdaq rallied to all-time closing highs on Monday. The market was driven by materials, energy, and financials. Energy rallied because oil was up 2.1% to a two-week high. The energy ministers from Saudi Arabia and Russia agreed in a statement that the production cuts should extend another 9 months to March 2018. This talk is mainly bluster before the May 25th OPEC meeting. As I have said, Iran and Iraq need to be a part of the deal or it won’t be effective. American frackers will boost production if oil goes into the $50s. If the cuts aren’t extended, oil can fall to the $30s. If the OPEC cuts are agreed to last another 9 months and Russia tags along, oil will spike higher after the meeting.
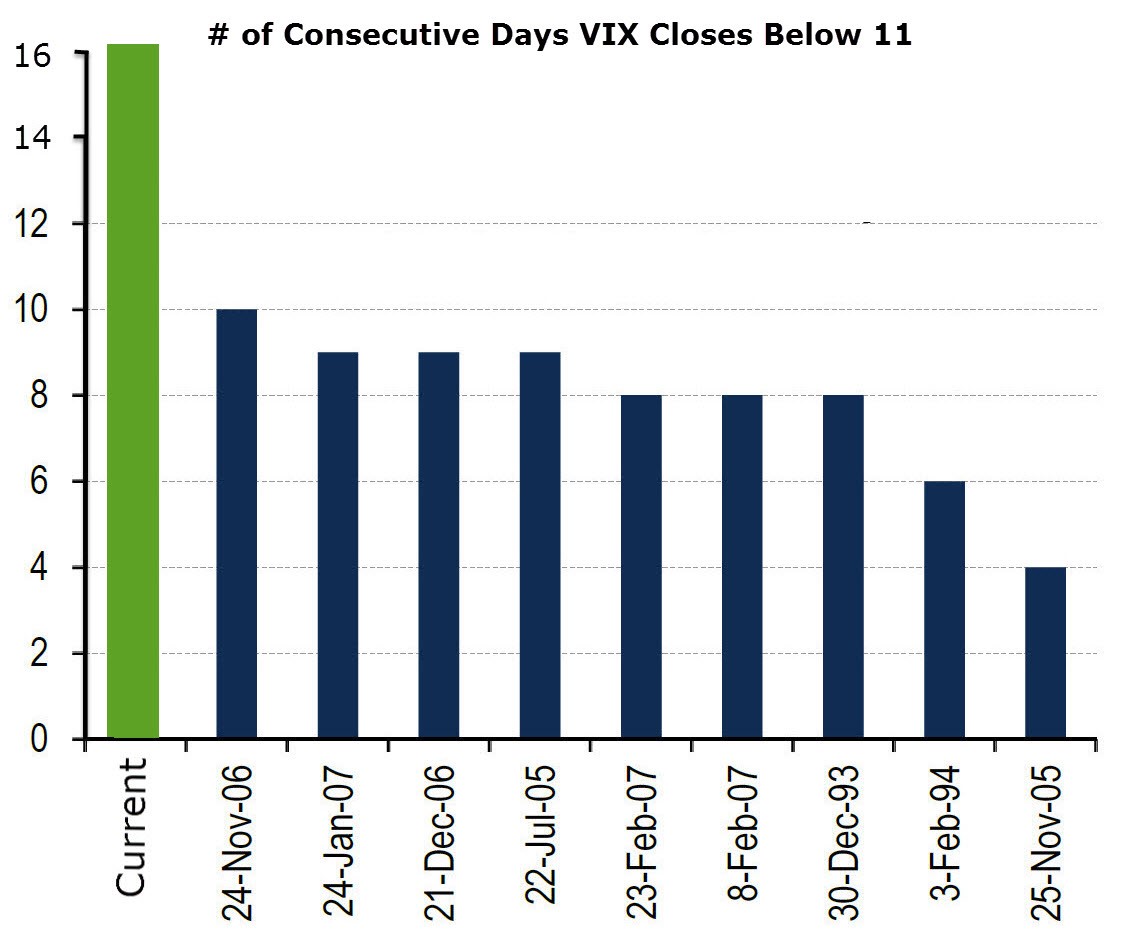
The implied volatility by the price action in Q1 was 8, so it’s not surprising to see the VIX trading at such low levels. The surprising part is the lack of movement in stocks. The VIX is acting as a score keeper to this sleepy market. As you can see in the chart below, the VIX has closed below 11 for the 16th straight day making this streak 60% longer than the prior highest streak.
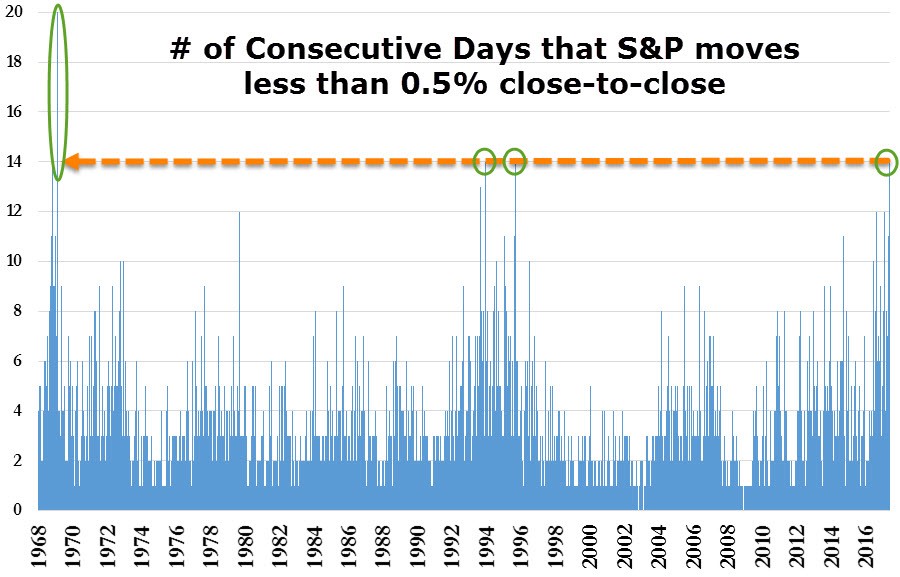
As I said, the VIX being low is an accurate depiction of how the market has been acting. The chart below verifies this claim. As you can see, the S&P 500 has had 14 straight days of consecutive closes less than 0.5% different from the previous close. This is the longest streak since 1995. The last time there was a 15-day streak was 1969. There seems to be nothing which can affect this market. While it’s fair to say earnings growth is strong which should boost stocks, there have been many quarters where earnings growth was great since the mid-1990s yet this streak hasn’t been matched. As you can see, there were also two 12-day streaks recently.
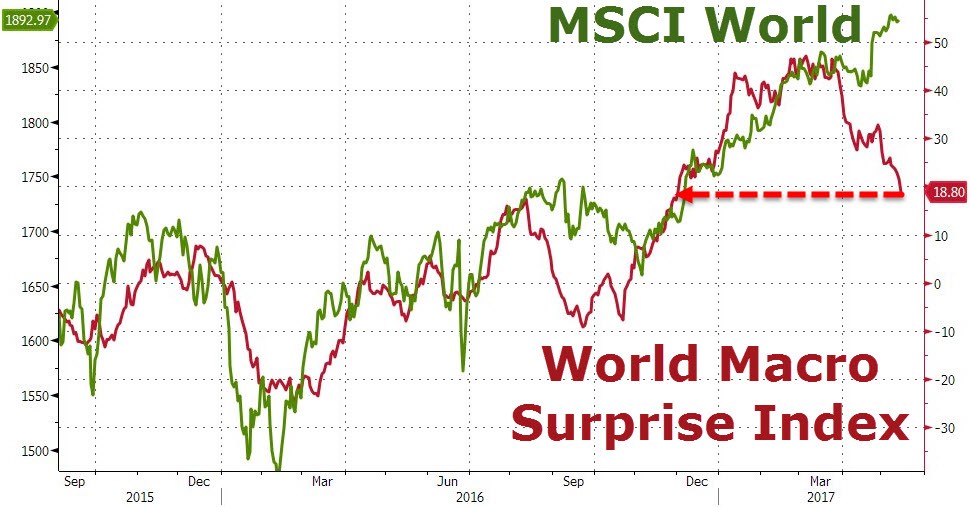
As I have mentioned previously, the Citi Surprise Index has been falling in America and it has been strong in Europe. As you can see in the chart below, global stocks are rising while the World Surprise Index is declining. The index is likely being driven down by America. It’s still positive, signaling the data is not as bad as it was in early 2016. As you can see, on a global basis economic indicators were flashing red in early 2016 as the World Surprise Index was -20.
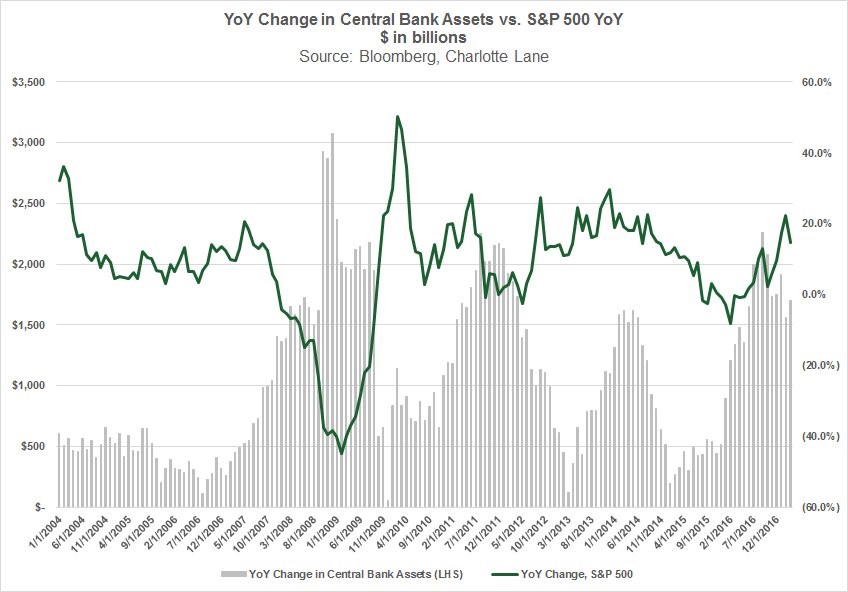
I have discussed previously that the economy would have gone into a recession in early 2016 if it wasn’t for global coordinated central bank action. The chart below shows the year over year change in central banks’ balance sheets as compared to the year over year change in the S&P 500. The grey bars went up when the Fed initiated each round of quantitative easing. As you can see, the first round was in 2008-2009, the second round was in 2011-2012, and the third round was in 2014. There was never a QE4 implemented, yet there are grey bars which started increasing in early 2016. That represents the moment when the global central bankers prevented a recession.
While the Fed’s goal is to have low unemployment and price stability, my fear is that by stamping out recessions and volatility in stocks, the next recession will be worse than ever. An analogy for this situation is the government spending excessively to the tune of hundreds of billions of dollars. It helps the near-term economy, but hurts the long-run growth. The options are either that central bank action is the greatest new monetary policy innovation which prevents risks or that it has consequences which haven’t been witnessed yet. I’m going with the latter option. The results will be revealed in the next recession or when the Fed unwinds the balance sheet (could be simultaneous).
As was mentioned, the soft survey data has been missing expectations causing the American Citi Economic Surprise Index to fall into the negatives. The Empire State Manufacturing Index missed expectations Monday. This is consistent with the trend of survey weakness. The reading was expected to come in at 7, but instead it was -1. This is a sharp decline from the April report which was 5.2. As you can see in the chart below, the index has retraced half of the move downward which occurred in 2015. There was a manufacturing recession in 2015, so a repeat of that trend is bad news. The Empire State Index is the first regional Fed index, so we’re not off to a good start.
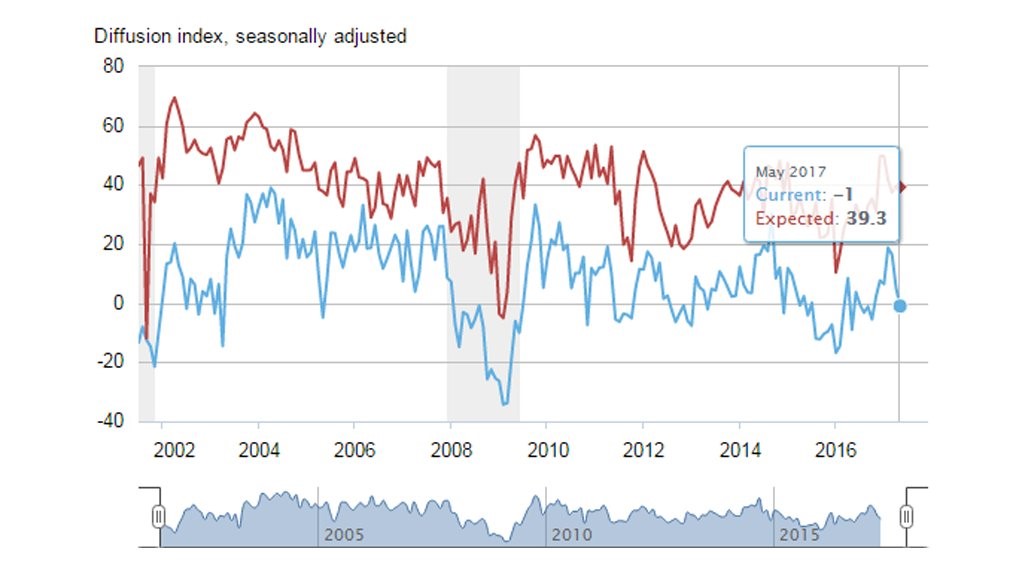
I would describe the current -1 rating as a yellow flag. A red flag would be -10 or below. The new orders diffusion index dipped sharply from 7.0 to -4.4. The unfilled orders index, which had been negative for years, up until the past few months, dipped from 12.4 to -3.7. The prices paid index fell from 32.8 to 20.9. This is consistent with the deceleration we’ve seen in inflation. As far as forward looking indicators, the two that stand out to me are the cap ex decline from 27.7 to 13.4 and the decline in the average employee work week from 17.5 to 5.2. The only good part of the report was that the general business conditions index only fell 0.6 point. This was not a good report overall, as an irrationally optimistic outlook doesn’t make up for the weak details and headline number.
Conclusion
The stock market is ignoring the weak survey data as it moves higher in a slow fashion. I expect the VIX to rise above 11 and there to be a close with a greater than 0.5% difference this week, but it’s an open-ended question as to what will move this market. Earnings growth doesn’t justify such an expensive stock market, although I do understand why it rallied. I’m working off the assumption that margins won’t rise much further, while the street thinks margin growth can make new highs. Margin growth is the only way profits can grow above their 7% trend in a weak economy.