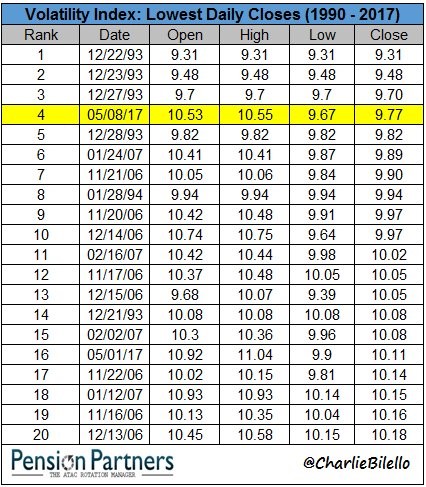
The top story in the markets is the lack of volatility. The VIX has been hovering between 9 and 10 which is historically low. Actual price volatility is 48% of its long run average and has been near that point for 77 days. The chart below shows the lowest closes the VIX has had since 1990. As you can see in the chart below, there have been three lower closes in 1993. Volatility is so low that Goldman Sachs CEO Lloyd Blankfein stated that the market’s low volatility is worrisome. It’s rare for the CEO of Goldman Sachs to make a statement on volatility. The feeling around volatility is that it’s the calm before the storm. Historical market action implies that volatility will increase in the near-future, but that doesn’t imply stocks will have a major swing lower.
The correlation with rising volatility and S&P 500 returns is 1.1% meaning if volatility rises in the next few weeks, it doesn’t portend doom in the intermediate-term. 250 day returns and price volatility have a -43% correlation which means when volatility spikes higher in the next few weeks, stocks will fall. We may have our first 5% correction in May or June. There needs to be a catalyst as stocks won’t fall without one. The June rate hike and the May 25th OPEC meeting could act as catalysts or it could be something unforeseen.
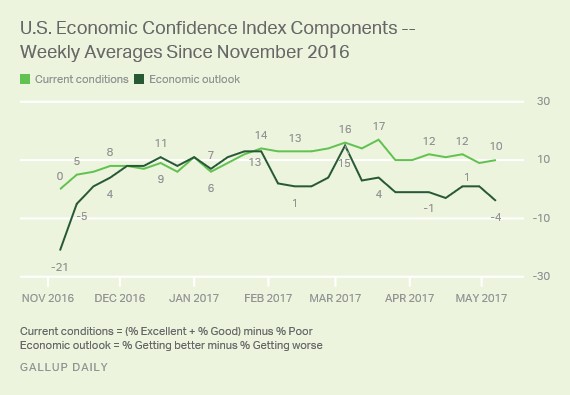
The trend I have been projecting in the past few weeks is that soft data will begin to weaken. We’ve seen evidence of that from the decelerating ISM manufacturing report. The two key indicators which I’m expecting to fall the most are consumer confidence and small business confidence. The chart below supports the trend I have projected as the Gallup economic outlook survey hit -4 which is its low for 2017. The current conditions index fell to 10 which is 7 points below the peak in March.
The economic outlook has more volatility than the current conditions because usually economic changes happen slowly unless we’re headed into a sharp recession. Forecasts can change dramatically based off anticipated policy changes. The lack of fiscal stimulus has begun to be a drag on the consumer’s excitement. There won’t be any news about healthcare or tax reform passing for the next few weeks as the Senate begins to tackle the divisive plan the House sent it. As the media repeats the story that 24 million people could lose their coverage it could scare consumers into saving more. That’s not an opinion on the policy itself. It’s a perspective on how the media can influence the consumer’s behavior.
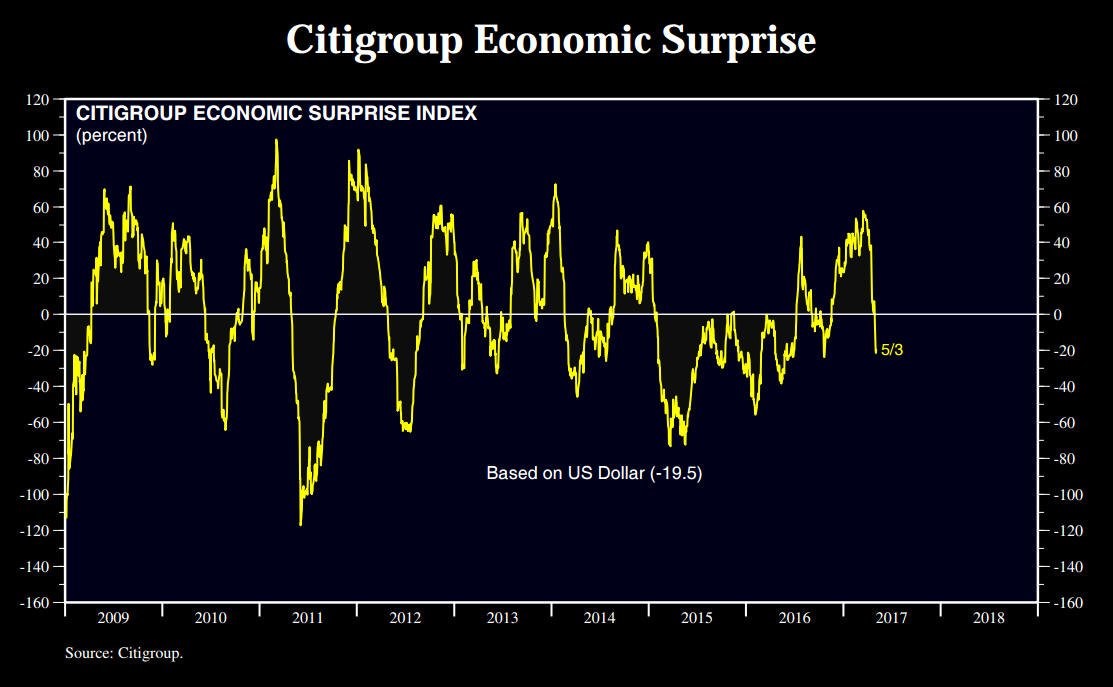
Obviously one Gallup poll doesn’t mean there’s a trend in the data. It’s just one perspective on consumer sentiment which may not be supported by other polls. Proof that there is a trend towards weakening soft data can be seen in the chart below. It shows the Citigroup Economic Surprise Index. As you can see, on May 3rd the index was at -19.5. Anytime the index is negative it means the economic reports are missing expectations more than they’re beating them. The positive trend of improving soft data since the election has ended. It’s interesting to see how bad the index looked in mid to late 2015.
It’s clear to me that the global central bankers saved the financial system in early 2016 as a recession seemed imminent. It’s important to recognize that the central bankers intervened because if you don’t, you’ll believe the indicators flashing recession signals were all wrong. They weren’t wrong. The central bankers were able to save the day, temporarily. Because the central bankers saved the economy in early 2016, it reinforces a positive feedback loop for stocks. Because private investors believe the central banks will calm the markets, they take more risk, pushing the VIX to near record low levels even though the Citi Economic Surprise Index is negative and GDP growth was 0.7% in Q1. It’s not a good situation for the central bankers to be in because they don’t want to be relied upon to save the day every time there’s an economic blip. This is because when the central banks can’t handle a small blip, it can lead to mayhem. It’s tough to say which challenge won’t be solved by central banks, but the entire economy is on the line whenever they are forced to act.
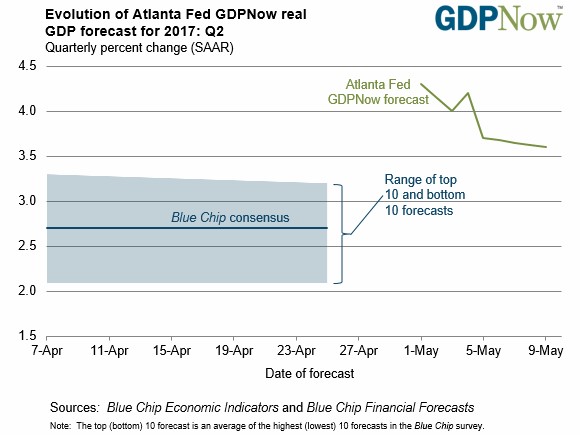
Speaking of GDP growth, the latest Atlanta Fed GDP Now forecast has moved sharply lower from 4.2% growth to 3.6%. As you can see from the chart below, it’s still much higher than the 2.7% growth the blue-chip consensus is at. It’s also almost double the growth rate the NY Fed is expecting (1.8%). I’m expecting growth to fall closer to the 0.7% seen in the last quarter, but it’s way too early to make projections. Technically, we still don’t have a great idea of what Q1’s actual GDP growth was because the 0.7% growth is subject to revisions. The first revision will be released May 26th.
The April BLS non-farm payrolls report caused the GDP Now to lower its estimate for real consumer spending growth from 3.0% to 2.7%. It’s still early, but this is a bad sign since the consumer was so weak in Q1. The real private fixed investment growth estimate fell from 6.9% to 5.3%. This was a strong part of the Q1 GDP report. The wholesale trade report caused the estimate for contribution of inventory investment to decline from 1.11% to 0.99%.
Conclusion
The VIX closed below 10 for the second straight day on Tuesday. It is striking fear into the minds of investors as they anticipate an increase in volatility. While it may cause pain in the short-run, it doesn’t mean the bull market is over. A more worrisome stat is that the Citi Economic Surprise Index is negative. The market rallied earlier this year even though the hard data was weak. Now it’s rallying even though the soft data is missing expectations.