There is an interesting bifurcation in the economic data and the earnings data which I will discuss in this article. The reason I say it’s interesting is because it’s unexpected and unsustainable. It’s simply impossible to have a long period where earnings are growing above their trend and GDP is growing below its trend because both the productivity and the labor force growth are decelerating. This scenario can exist temporarily when margins are increasing, but it’s not a long-term way for stocks to go higher.
I know many corporations earn most of their money internationally, but my counterpoint is that Europe and Japan are seeing the same GDP growth weakness America has seen. When I say GDP growth weakness, I’m discussing a long-term trend where a stagnating labor force prevents mid-single digit GDP growth from occurring. The second counter point I have is that companies have issued a large amount of debt which wouldn’t occur if they were making such large profits overseas. These debt issuances are being used to buy back stock which artificially boosts earnings per share metrics.
As an addendum to making the point that earnings can’t grow above trend while GDP grows below trend, I will say the corporate debt can’t grow while GDP growth is sluggish. Also, profit margins will be suppressed when interest rates rise, especially on junk bonds. Junk bonds are cyclical, meaning they go in and out of style on Wall Street causing large swings in the price of debt. You cannot model in the expectation that the cost of capital will stay low forever. I am in the camp that sees interest rates remaining low this year, but I recognize this isn’t an eternal trend.
Bulls will argue that no trend will last forever, so my point doesn’t have substance. However, there are certain trends which are so counterintuitive, they throw up bright red flags. An example I’ve used previously is Tesla having massive losses, while being the most valued automaker. Even a non-finance person can recognize something wrong with that.
Many bullish investors are betting on an improving economy thanks to a stimulus plan passed by the GOP Congress. While I have described why the GOP may not pass the plan, that is a discussion which doesn’t have much data to back it up. I can explain how the debt is making it difficult to cut taxes, but I acknowledge it is possible to do. That analysis comes down to whether the moderate and conservative GOP members can compromise. No one can be sure what politicians will do.
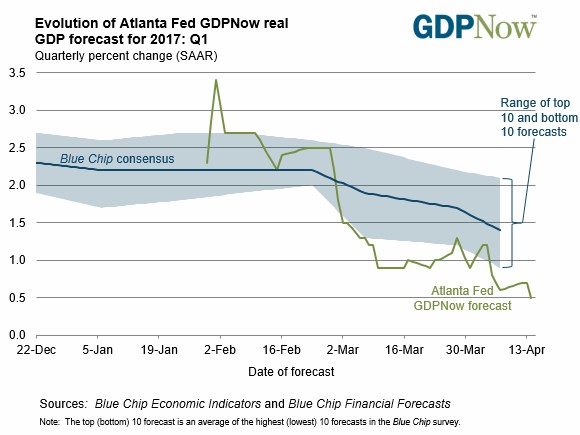
What we can be sure of is that the economy slowed down in Q1. If a bull says the economy is going to accelerate after the stimulus program, my response is “from what level?” There is a big difference between an economy accelerating from 2.5% growth and an economy accelerating from 0.5% growth. That 0.5% growth rate is where the GDP Now forecast sees the economy growing at. As you can see from the chart below, the GDP Now forecast fell from 0.6% to 0.5%. The blue-chip consensus fell to 1.4% which is the lowest it has been all quarter. Even the bullish NY Fed model lowered its estimates for Q1 & Q2. It now sees 2.6% growth in Q1 and 2.1% growth in Q2. If the economy grows at 0.5%, it will be the weakest economy to have a Fed rate hike since 1980. This confirms my point that the Fed is not data dependent.
The reason the GDP Now estimate fell was because of the weak retail sales and the weak CPI report. They knocked down the estimate for consumer spending growth from 0.6% to 0.3%. That’s a shocking estimate to read given the optimism expressed in the consumer surveys. It’s an obvious estimate when you look at the bankruptcies in retail. It’s looking like the consumer surveys are showing blind faith by Republicans in Donald Trump. That’s not a partisan statement. The fact is that consumer spending is weak, yet Republican consumers are optimistic. They have high hopes for the future, but those hopes aren’t being met in the present.
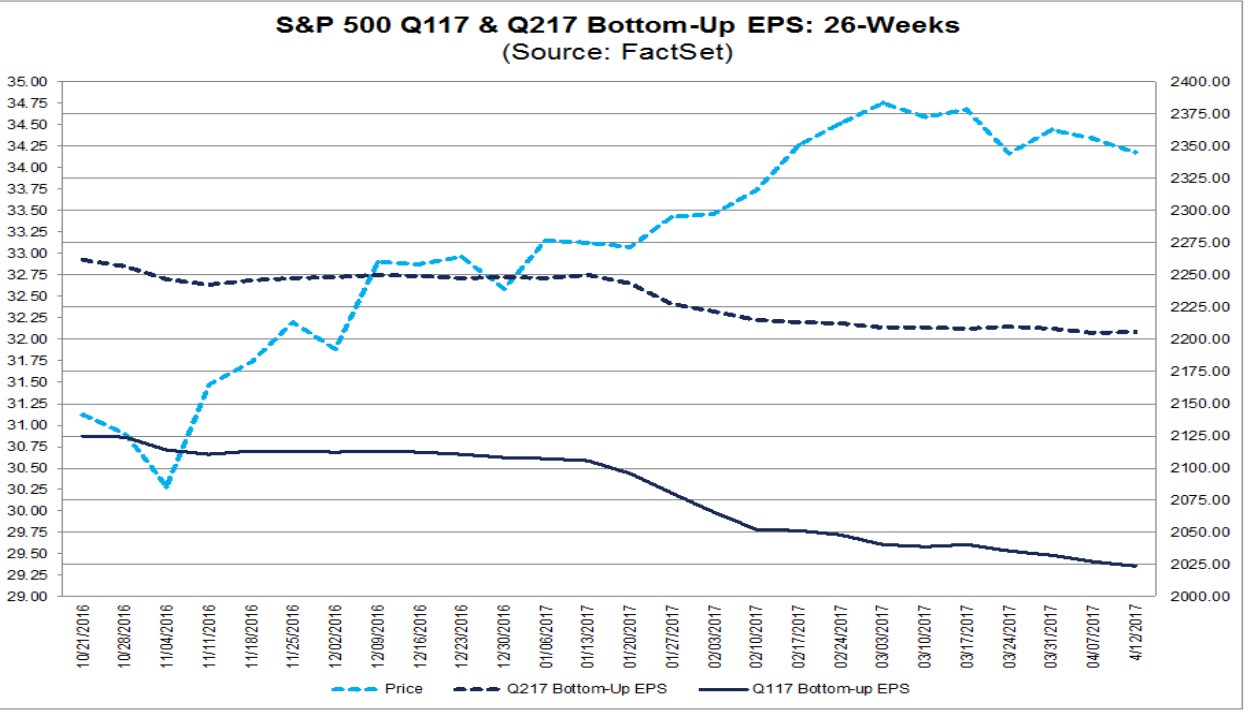
Even with the 0.5% GDP growth, the Q1 bottom-up earnings per share is looking impressive. The S&P 500 earnings are expected to increase 9.2% in Q1. I have previously mentioned that earnings per share estimates usually collapse right before the quarterly reporting period because analysts want to make sure companies can beat estimates. This quarter was an exception as you can see in the chart below. Earnings estimates drifted lower, but there wasn’t a plunge which usually happens. The recovery in earnings in Q1 will likely be strong as margin expansion and revenue growth push it higher. Revenues are expected to be up 7.2%. As you can see below, the Q2 bottom-up estimate has fallen more sharply in the same period. Q2 earnings are expected to grow 8.7% and revenue is expected to grow 5.2%. These estimates still have a few months to fall further as Q1 looks to be the high point of the year.
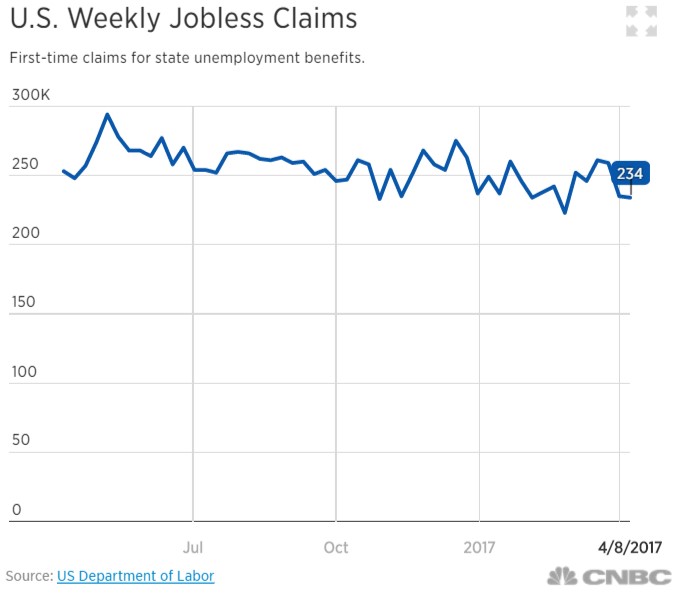
The final piece of the puzzle is the jobless claims. Usually a low jobless claims number, like the one in the chart below, means margins won’t expand further. However, we are in unusual times. The jobless claims are at a record low compared to the population, but the hourly wage growth hasn’t been as high as the previous two cycles. There must be a large amount of legacy slack in the labor market from the recession. The labor participation rate ticked lower than it should have when adjusting for the average age of the population. The reason why jobless claims predict when profit margins sink and rise is because they usually reflect the hourly earnings increases. Usually when jobless claims sink, it means the labor market is tight and workers are getting raises. That’s clearly not happening in this cycle.
The pessimistic way to look at the cycle is it may end in the workers never getting a substantial raise above CPI growth. The optimistic way to look at corporate earnings is to say profit margins may expand because the labor market still has slack. The amount of slack in the labor market has not been quantified in any metrics I’ve seen which makes it difficult to analyze.