This week is going to be centered around the Fed’s decision on interest rates on Wednesday. This rate hike will be met with much less angst than the previous two as investors become accustomed to the Fed raising rates at a faster clip than 25 basis points per year. The decision on rates will be the least important part of the announcement because the market is so certain it will raise rates. The CME Group Fedwatch tool has the Fed at a 95.2% chance of raising rates.
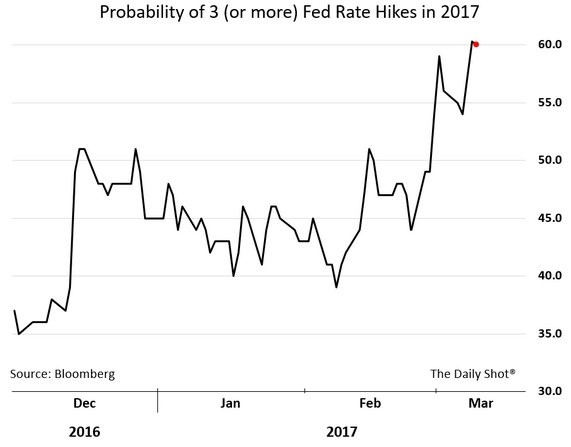
The key will be the Fed’s guidance; this will either be a hawkish hike or dovish hike. This hike will different from the first two as it will likely be more hawkish considering the Fed has two more hikes left to go this year. As you can see in the chart below, there’s about a 60% chance there will be three rate hikes in 2017. In talking up the odds for a March rate hike, it’s implied that it will continue down the path of its original guidance. If the Fed talks about its balance sheet, it will be the biggest news of the statement. In my opinion, the Fed will either discuss unwinding the balance sheet or not discuss it at all. Not discussing it would be a dovish signal. Goldman Sachs expects the unwind to start in Q4 which means discussion must begin soon to explain to the market the specifics of how it will get done.
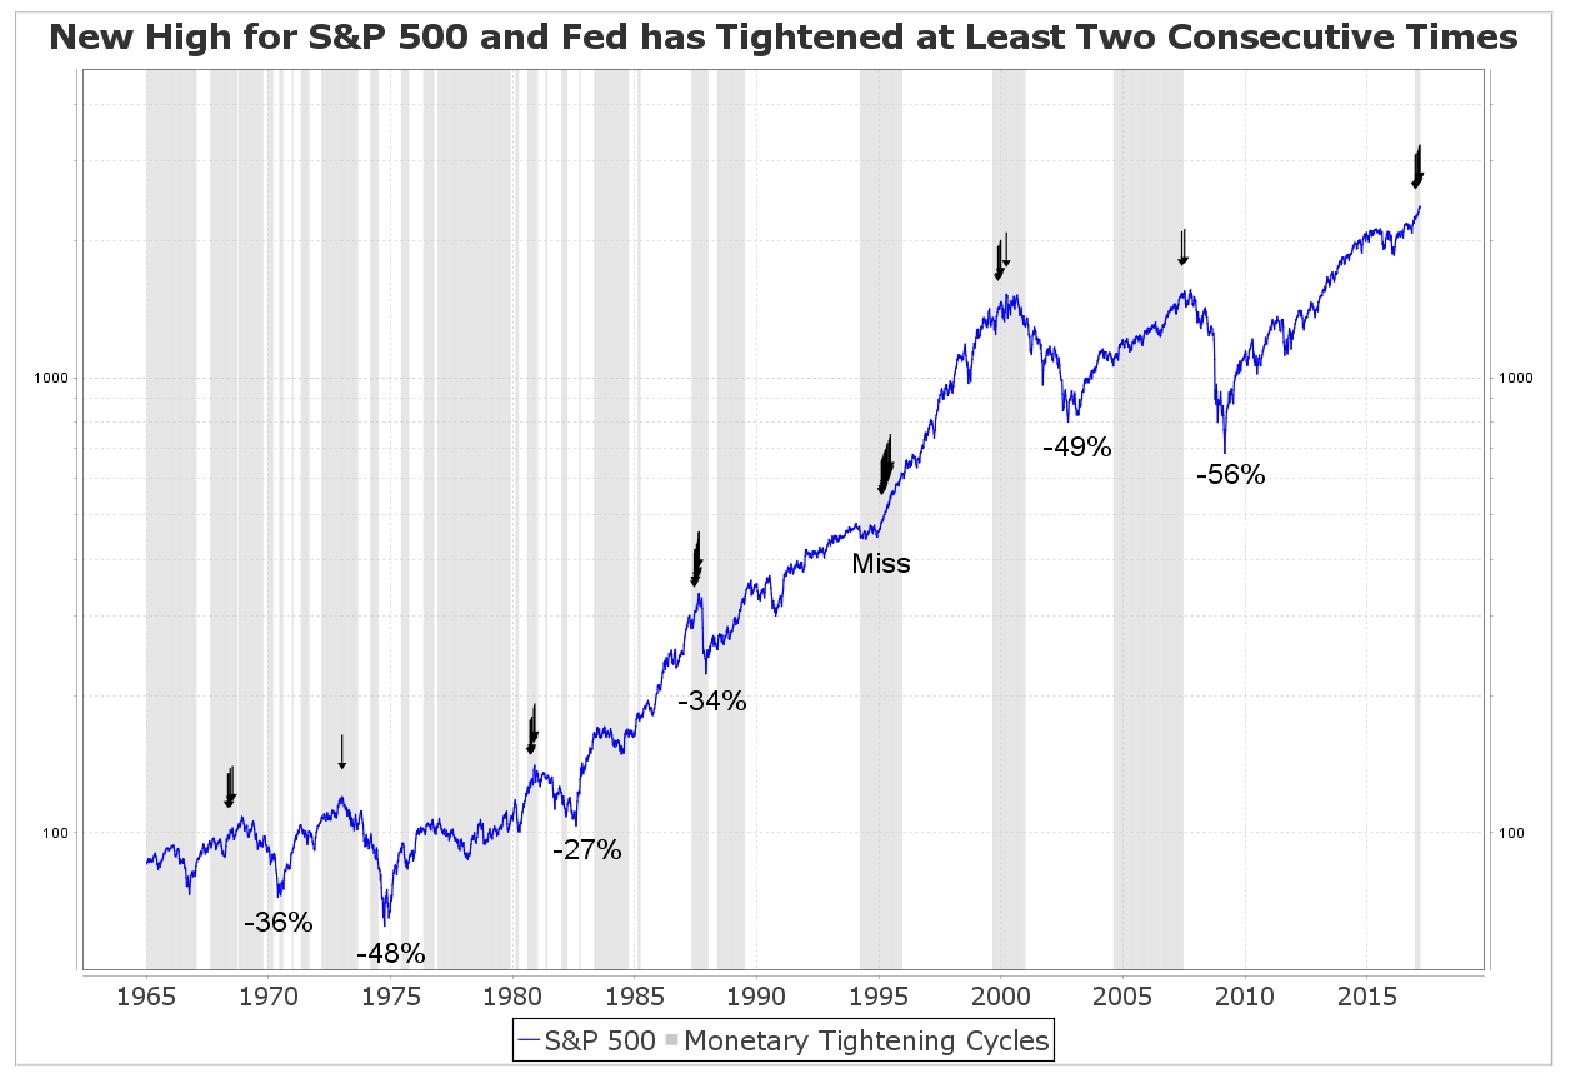
A tightening Fed is a bearish signal for stocks after the first two rate hikes. Because it started out slow, I think the negative signal is slightly delayed. However, given the accelerated pace for 2017, I think the negative signal is now in place. As you can see in the chart below, the sell signal, which is triggered when the Fed tightens two consecutive times and the S&P 500 is at new highs, has been correct six out of seven times. The accommodative cycle we just exited was the longest ever. I contest this means the bubble is the biggest, but that remains to be seen.
FactSet released it’s the latest aggregate earnings data Friday afternoon. The reports aren’t as data laden as they had been in the past few weeks because earnings season is over. The only information we have is changes to earnings expectations for Q1 and the full year 2017. The latest estimates are positive because there wasn’t much change in the bottom-up estimates. As the saying goes ‘a bird in the hand is worth two in the bush.’ The estimates previously seen are now more likely to occur as we get closer to the reporting period.
The Q1 bottom-up estimate was $29.59 previously and now it is $29.58. The full year 2017 bottom-up estimate was $131.26 previously and now it is $131.28. Q1 earnings are expected to grow 7.2% and full year earnings are expected to grow 9.8%. Energy earnings estimates dipped slightly from 314.9% growth in 2017 to 312.2%. I doubt oil prices falling to their 3-month low has led to any declines in estimates yet. Analysts can’t respond to short term vacillations in crude oil prices. If it stays in a new range of the upper $40s, some estimates will start to be cut in the next few weeks.
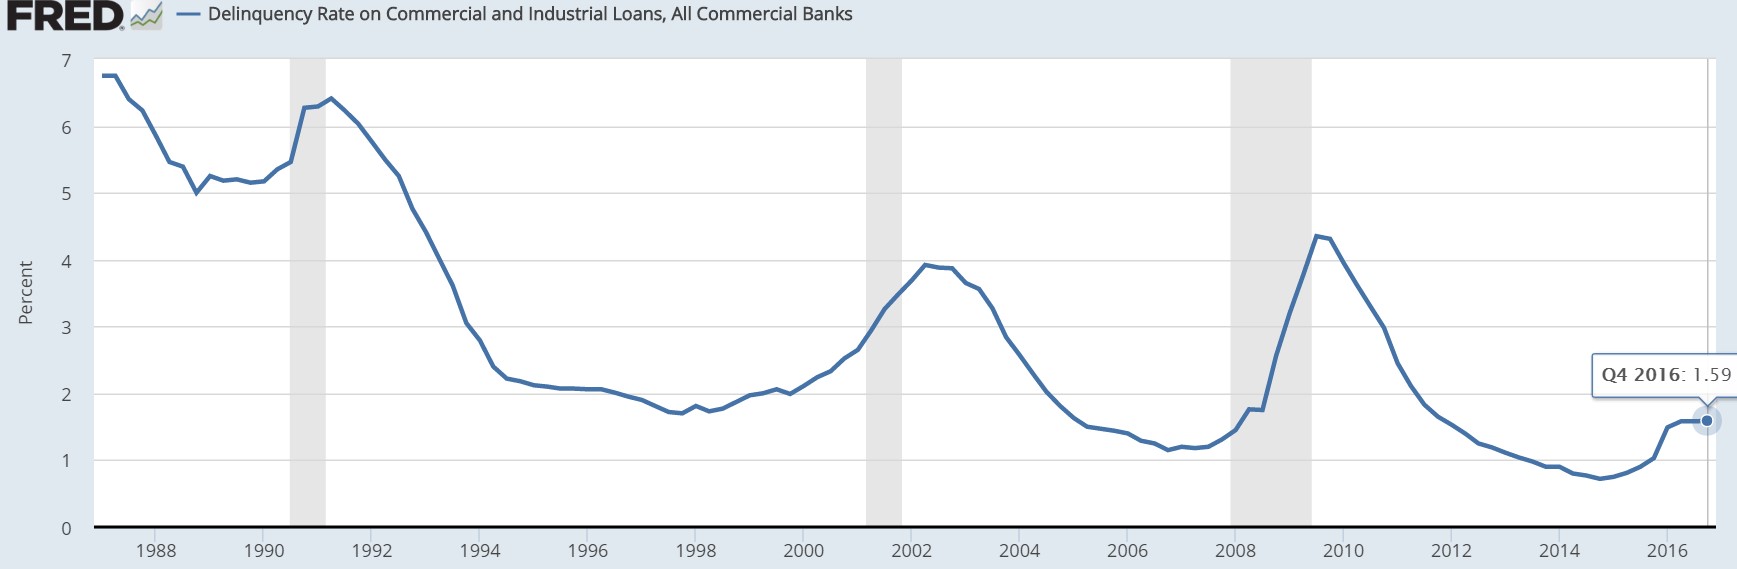
When analyzing the strength of the credit markets it’s important to realize the economy is not in the clear. The stabilization means that a recession isn’t imminent, but it doesn’t mean it has been put off completely. The chart below shows the delinquency rate on commercial and industrial loans has stabilized. It was 1.58% in Q2 and Q3. As you can see, it’s now 1.59%. With the weak economic growth in Q1, I wouldn’t be surprise to see the delinquency rate start to tick higher again. Leverage is high, so any slowdown in economic growth causes delinquency rates to rise easily.
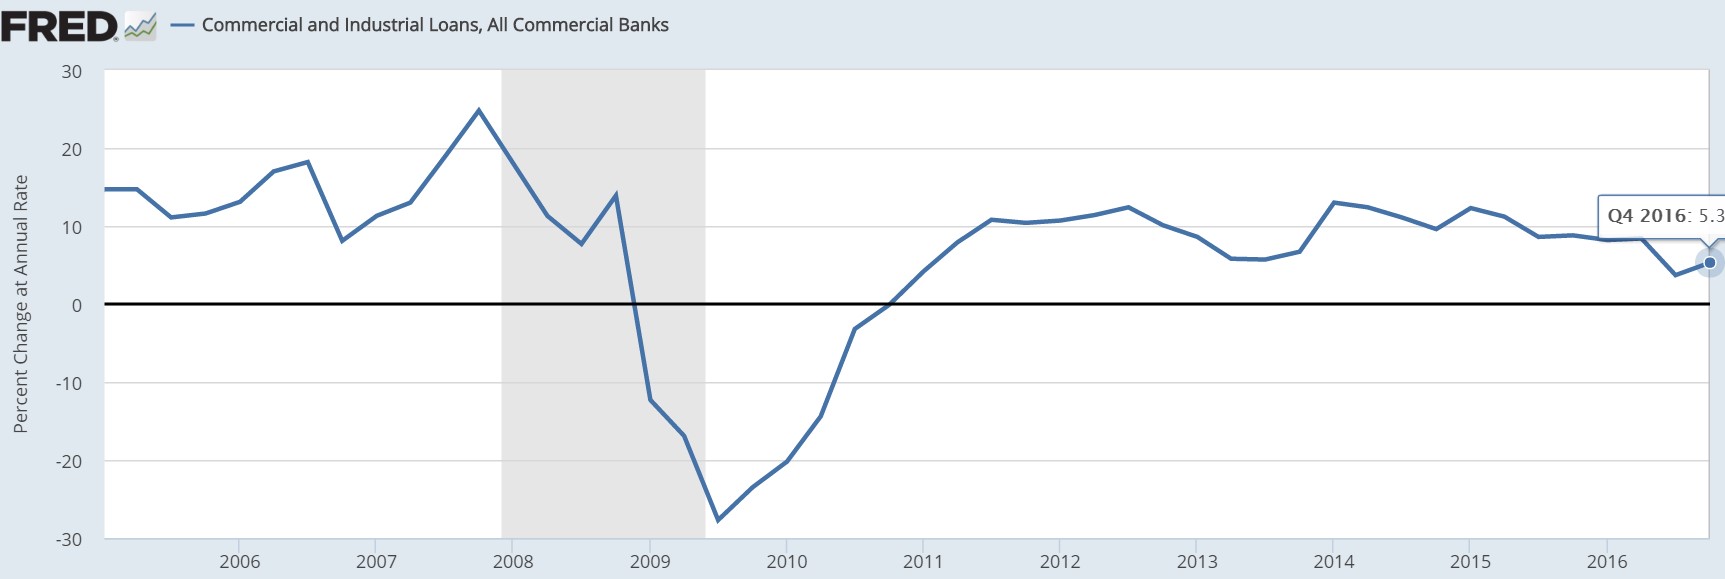
Growth in C&I loans was the slowest for the cycle in Q3 as there was a 3.7% annual growth rate. The rate increased to 5.3% in Q4, but I think this is a temporary bump higher. I think the Q1 GDP report will serve as a negative signal to small businesses owners who are showing such high rates of optimism in surveys. Animal spirits delayed the inevitable decline, but it’s still coming.
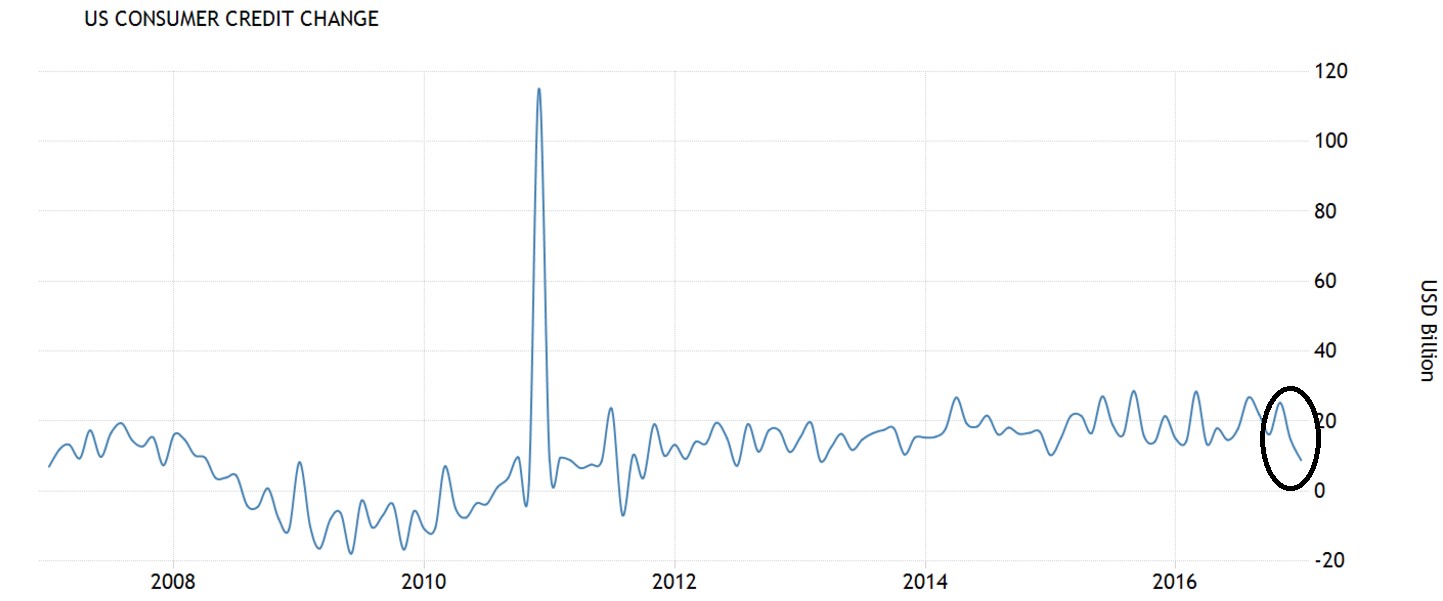
Even though there was a blip up in C&I lending, consumer credit growth has been decelerating. This slowing is surprising given consumer sentiment is the highest for this cycle. I circled the dip in the chart below. It took until the beginning of 2008 in the last cycle for consumer credit growth to start slowing. I’m not implying the economy is already in a recession; the timing of indicators changes each cycle.
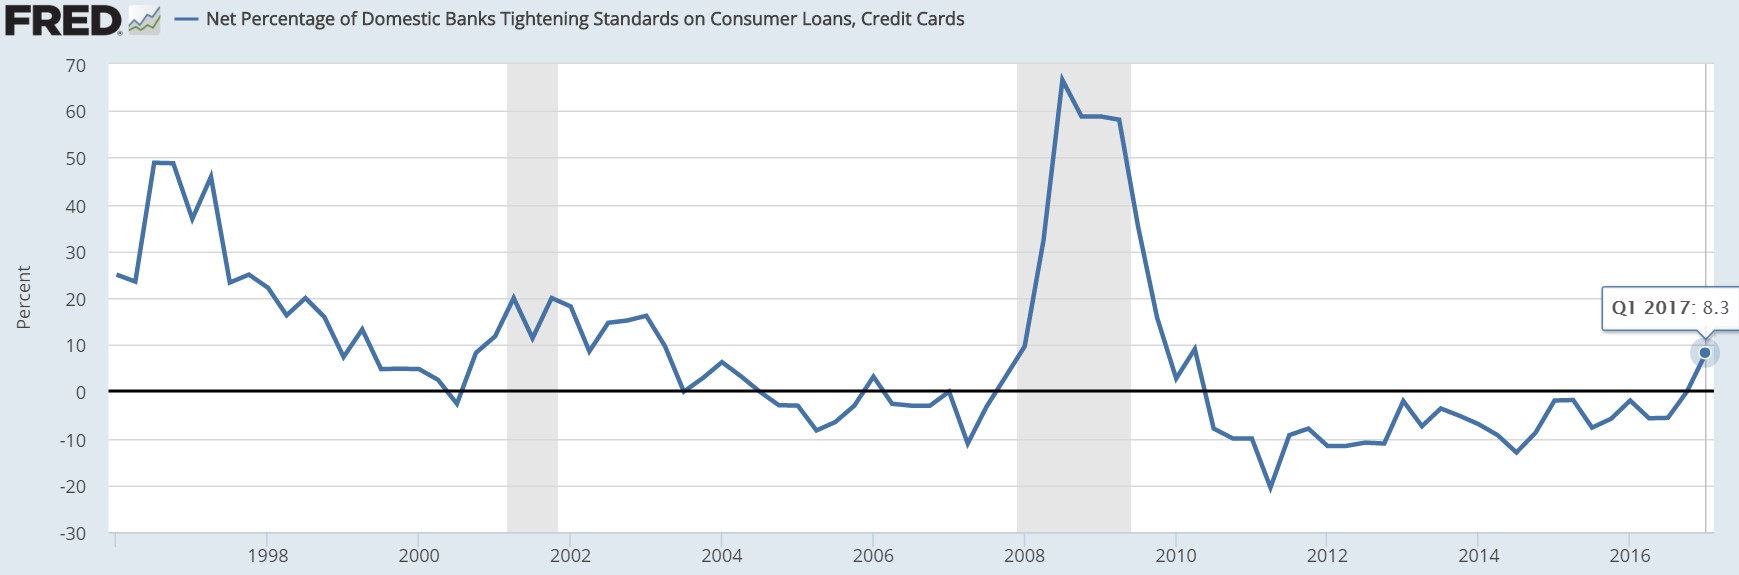
One reason consumer credit growth may be slowing is because lending standards have tightened. This is the first reported tightening since the economy was recovering from the recession in 2010. This is what happens when interest rates rise and the consumer is over levered.
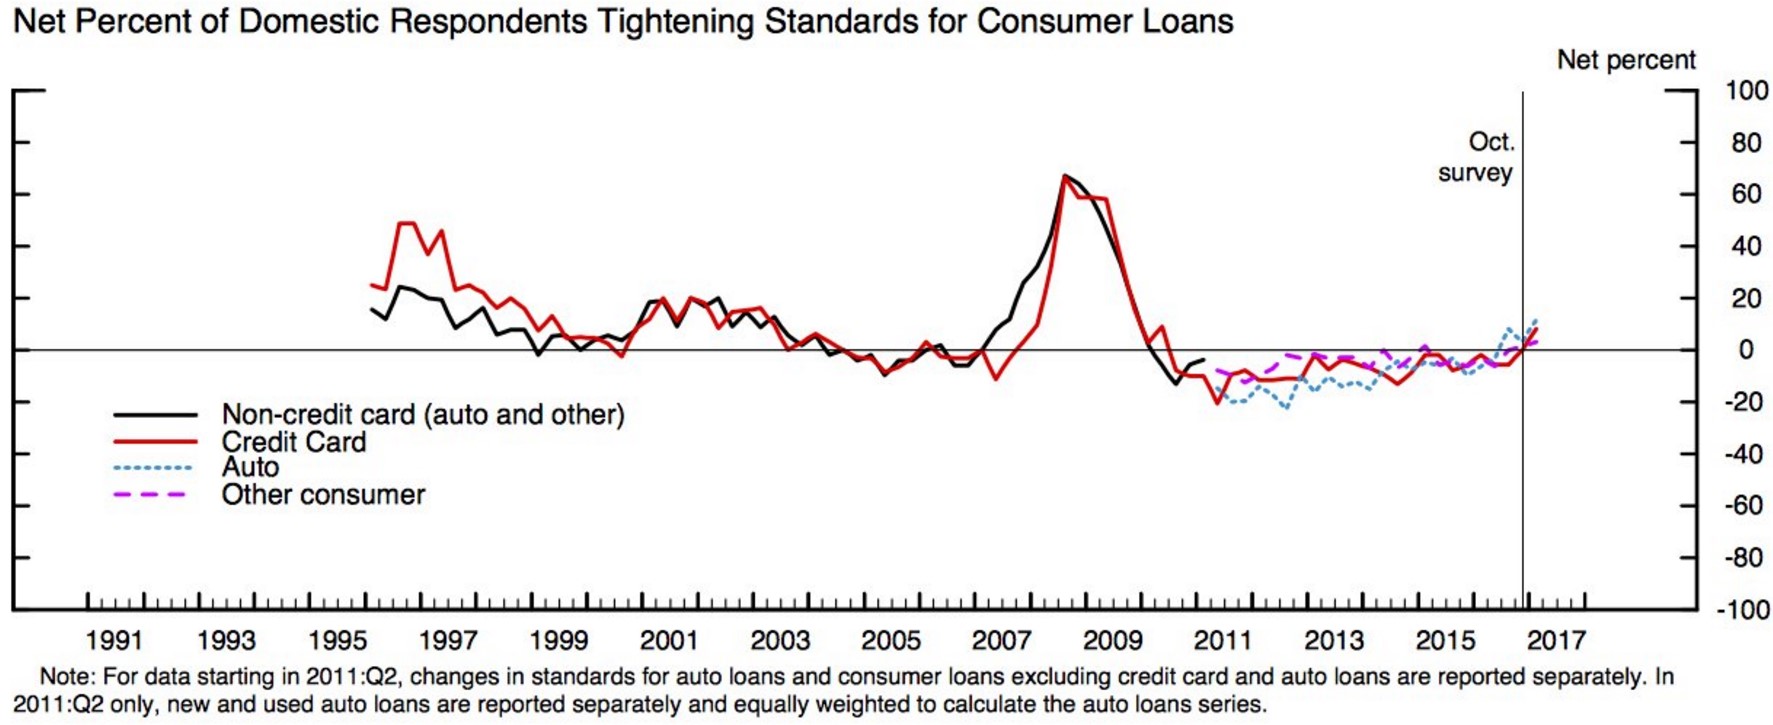
The final chart below breaks down the credit standards for credit cards, auto loans, and other debt. They’re all starting to tighten which signals the credit cycle may be entering the stress cycle. I was wrong in my prediction for this to occur in 2016 because the weakness in C&I lending in the first half of 2016 proved to be a false alarm. Learning from my previous mistake, current consumer lending tightness is a warning sign, not a red flag.
Conclusion
The Fed is about embark on three rate hikes in 2017. Tightening is historically a sign of coming stress in the credit cycle. We’re seeing that effect work its way into consumer lending, but not yet into C&I lending. In terms of GDP, the economy is at the weakest point of this recovery, yet the Fed has decided rate hikes should happen this year. The monetary policy tightening is being supported by the idea that fiscal policy will boost the economy. Just because small businesses and consumers are optimistic about the future, doesn’t mean the fiscal stimulus will be pushed through Congress. I doubt any of those groups are following the legislative process closely, meaning they can be wrong. This means the Fed’s reliance on these surveys is also a mistake.