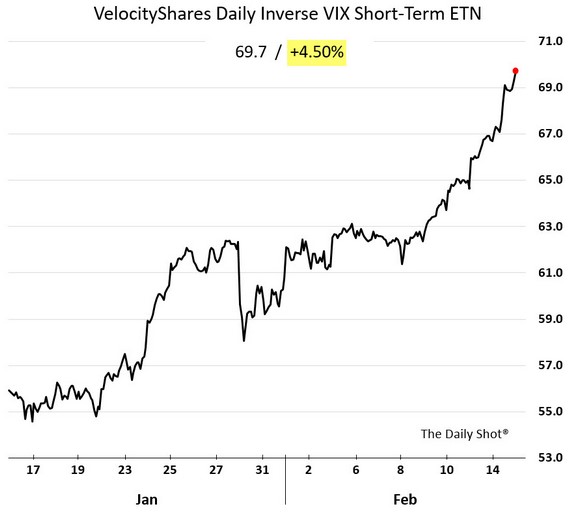
Wednesday was an abnormal day for the market because the VIX rallied along with the S&P 500. It was only the 4th day in history where the VIX was up over 10% and the S&P 500 also closed positive. The chart below shows what the inverse of the VIX looked like before Wednesday. Savvy investors may have thought it was overbought and used that determination as an indicator to take profits in stocks. It ended up closing down 3.8% today, but the market pulled off the unlikely and was up decently.
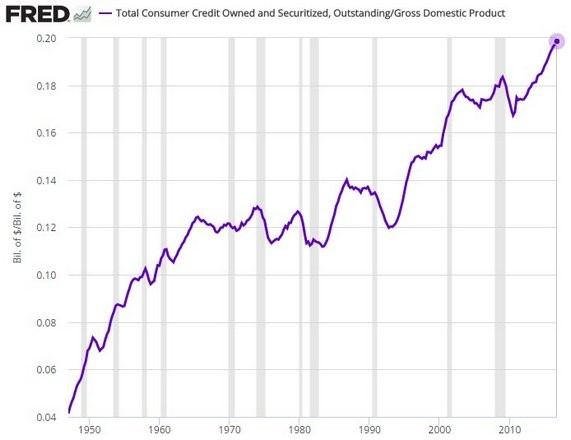
As someone who is always looking at charts, rarely does a chart shock me. However, the chart below did just that. It shows the total consumer credit owned and securitized compared to the GDP. It’s gone from 4% in the late 1940s to 20% today. This is scary. The catalyst for this rise is likely low interest rates and the financialization of the economy. When I say financialization, I mean the concept that accruing debt is better than saving money. Back in the days of the housing bubble, everyday Americans took on too much debt. The scenario unwound when housing prices fell. However, the concept of using leverage is interwoven into the culture. It’s a reversal of the generation that lived through to Great Depression as they were extremely cautious.
The chart below includes all debt except mortgages. If mortgages were included, the leverage in 2007 would be higher than now. The auto loan bubble is about $1.1 trillion. It is a large driver of the increased rate of leverage since 2010. The main historical driver of this chart moving from the bottom left to the top right is student loans. The student loan bubble will burst eventually, it’s just a matter of timing and how it happens. The average student graduates with about $35,000 in debt which is tough for millennials. Even though they’re more educated than previous generations, they earn less money. The trend of price increases of tuition is continuing. College students are protesting tuition hikes now. Imagine the outrage when interest rates rise which increases monthly payments. I don’t know what the limit to this chart is, but I know higher rates will lower it significantly. The government isn’t the only group which will be pinched by heightened borrowing costs. The stock market is ignoring the risk higher interest rates bring. As I mentioned before, culture affects financial and life decisions. If the bubble doesn’t burst by the time millennials have college aged kids, I expect the advice that they must go to college to have a successful life will not be passed down to them.
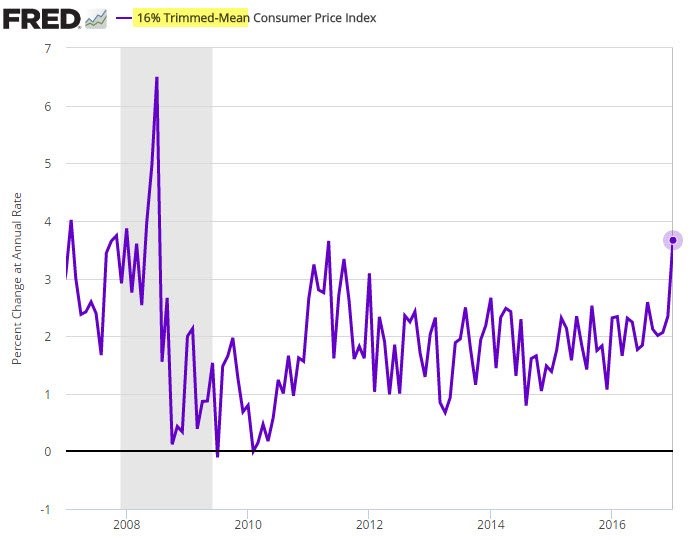
As I mentioned in my last article, the Fed’s favorite inflation indicator is the personal consumption expenditure. While the PCE being at 1.7% isn’t concerning, another favorite inflation index the Fed has is showing warning signs. The Fed’s other favorite index is the 16% trimmed mean consumer price index. This index excludes 8% of the CPI components with the highest and lowest one-month price changes from each tail of the price-change distribution. I view this as a smarter version of the core CPI. Sometimes it makes sense to exclude a component which is experiencing volatility even though it usually doesn’t. Food and energy don’t have a monopoly on volatility
As you can see, the 16% trimmed mean CPI is at the highest point since 2008. Out of all the inflation charts I’ve seen, this is the only one which shows inflation is at the highest point in the cycle. I have said if the trend continues, the Fed needs to hike rates fast. If this chart is accurate, the time is now. We don’t need to see more follow through in the trend to force the Fed’s hand. I’m expecting a hawkish tone without a hike on March 15th.
With inflation increasing, business optimism appears to be saving the economy from a stagflationary scenario. The NFIB business optimism index for January increased 0.1 point sequentially. I consider this fantastic because of the 7.4 point increase it had in December. This survey performed better than the consumer confidence expectations indicator which fell off slightly after its massive increase in December. The consumer confidence index appears to have been manipulated by politics as Democrats’ optimism waned significantly. The goal of the survey is to gauge what consumer spending will look like in the next 6 months, so that political despair may be meaningless. While small business optimism is founded on the concept that Trump will cut regulations, I think this survey is less influenced by politics. Business owners must remain objective. Buying more inventories and hiring more workers because the business owner likes the president would be the type of action which would bankrupt a small business.
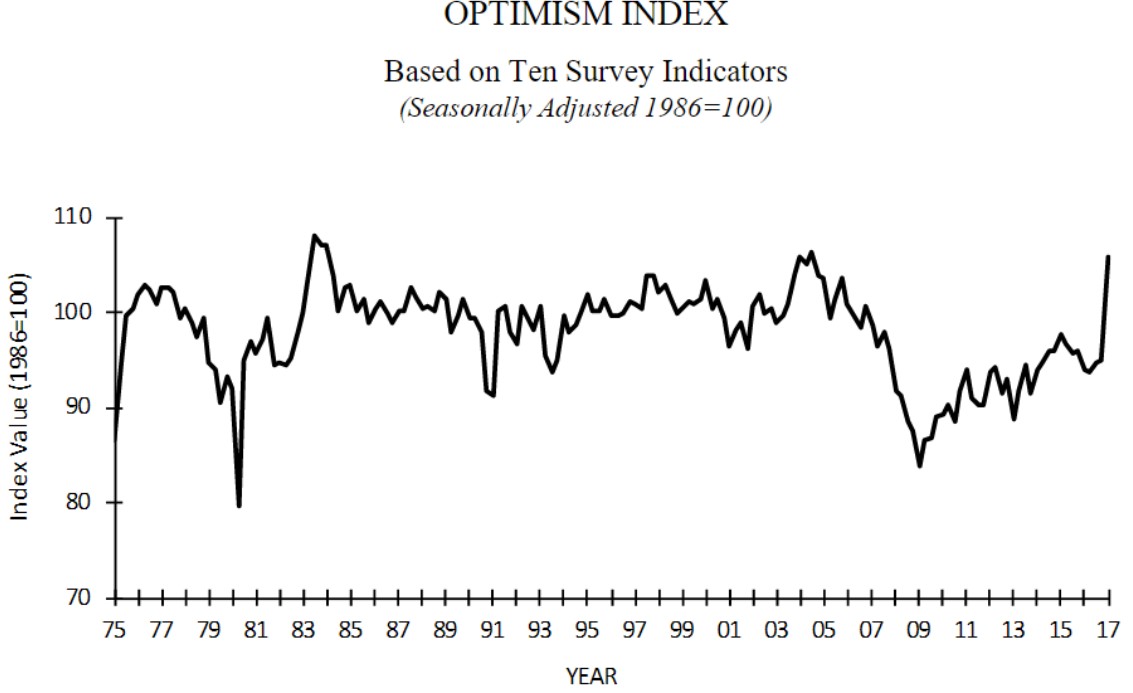
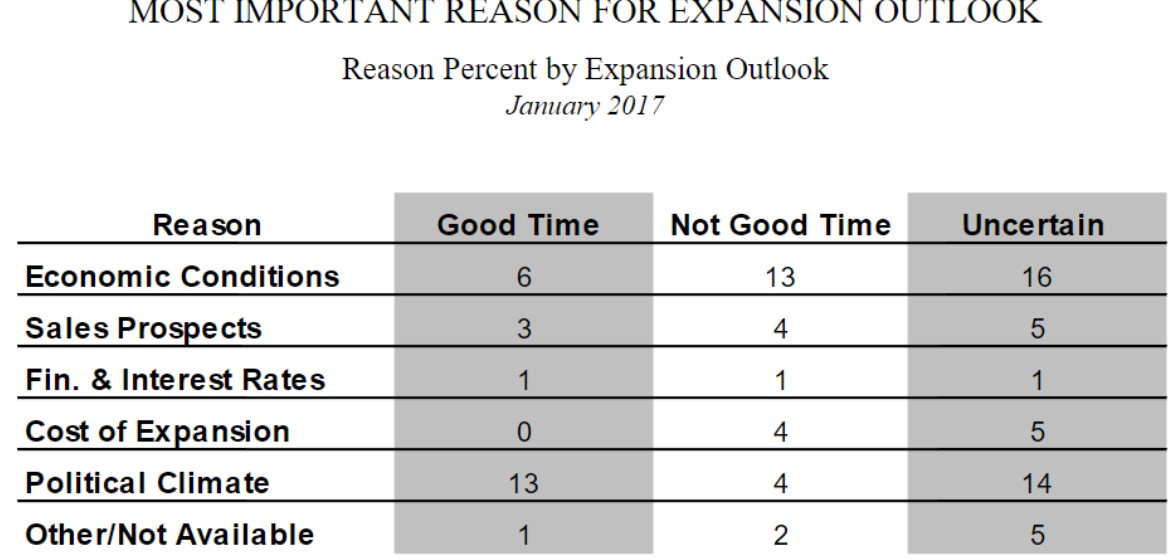
My thesis that the NFIB index is a more reliable indicator than the University of Michigan consumer confidence survey is based on the idea that business owners need to be more objective than consumers. It paints a more positive picture of the economy because the NFIB survey increased while the consumer expectations index fell. The chart below shows the importance of politics in the NFIB survey as the political climate was listed as the number one reason it is a good time to expand businesses. The fact that the economic conditions were the number one reason why businesses said it’s not a good time expand plays into the narrative that they are too hopeful.
Conclusion
The VIX cannot keep rising along with the market, so it must either start falling again or the market will need to have a correction. The rising inflation rate may force the Fed to raise rates faster than expected which would have a big impact on the payments for student loans. On the bright side, the NFIB small business survey showed small businesses are still banking on regulatory cuts as a reason to be extremely hopeful. As business owners, they must be objective which makes me trust them more than consumers who may claim they are pessimistic because their favorite presidential candidate lost.