In this post, I will respond to the article in the Atlantic which is titled “Dow 36,000.” The article is filled with contradictory statements and logical fallacies. I think it’s a good idea to debate the concepts it promotes head on. I’m starting the debate out on the losing end for some readers because they have recency bias. That same bias is what this article also suffers from. This bias is when investors look at recent performance and project it out over the long term. Usually projecting past results into future expectations isn’t catastrophic, however, it does become problematic at times of extreme movements. After the market fell in late 2008, if you projected losses in the future, you would have missed out on the bull market. If you were analyzing oil when it was at $147 per barrel and assumed it would go to $200 based on past results, you would have lost money on the long side.
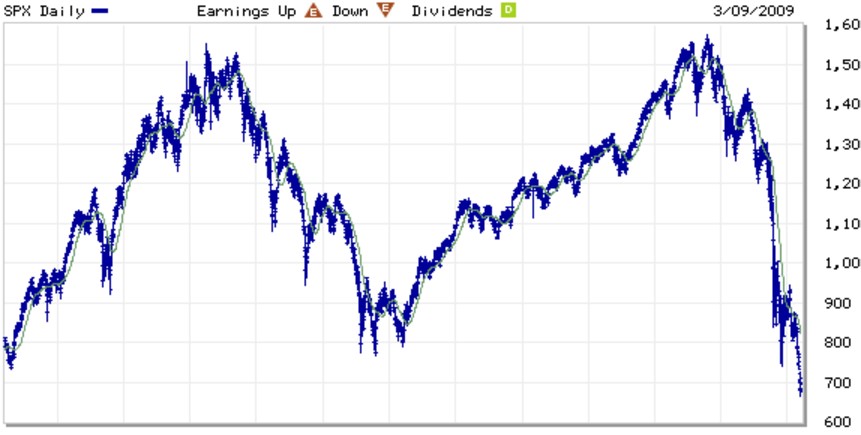
Recency bias is a seemingly innocuous aspect because it can affect an investor’s thinking even when he/she is trying to avoid it. One way investors try to avoid recency bias is by looking at long term charts. Investors reason that if they look at the long term, they can avoid this bias because its name implies short term thinking. However, even looking at long term charts can still be subject to this problem. For example, if you were looking at the stock market in early 2009, you may think stocks weren’t a good place to put your money. They hadn’t returned anything in 12 years (1997 to 2009). This narrative that stocks had zero returns since the start of the century was repeated by the media. Usually it’s better to buy an asset class after it has been left because it had bad returns
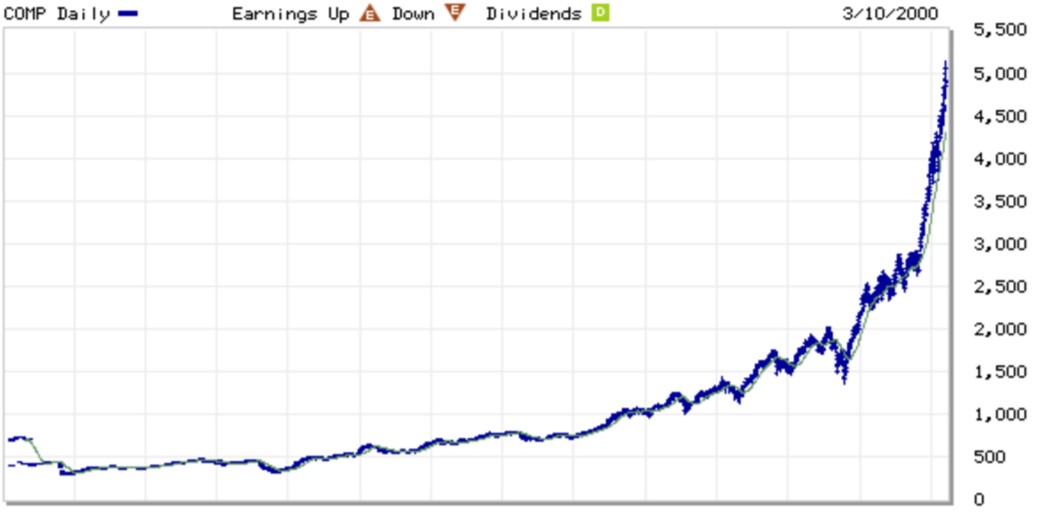
On the opposite side, if you analyzed tech stocks at the peak in 2000 or oil at the peak in 2007, you would think if you bought them at any time in the past it would have been a great decision. The faulty conclusion about tech stocks was that because they were always increasing, it was always a good time to buy them. When you are looking at an asset class that is in a bubble, it will look like you can buy it without regards to timing or valuation and do well. The chart below is a 13-year chart of the Nasdaq leading up to its burst. Whenever risk averse investors decide to pile into a bubble because they think there is no risk, it’s time to sell that asset.
The Atlantic article is very long which is unsurprising given the tall task of convincing people that traditional valuation metrics don’t matter. I will analyze the beginning of it in this post. The article misses the concept that those who advocate reviewing traditional valuation metrics don’t say that valuations work to time stocks. They act as a measuring template for when great bargains are arriving or when bubbles are forming. The idea that PE ratios don’t forecast when the tops and bottoms will arrive doesn’t discount their usefulness.
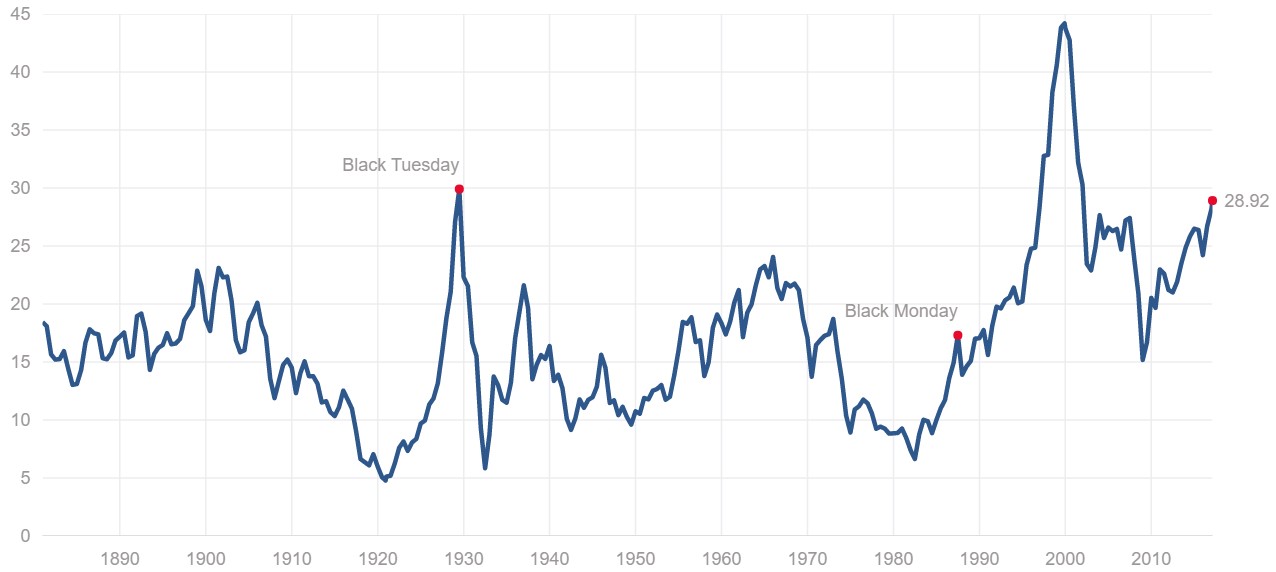
The article starts off on a contradictory note. It says “stock prices could double, triple, or even quadruple tomorrow and still not be too high.” This is contradictory to the title which says the Dow could go to 36,000. If the authors think the Dow can quadruple, it would have made for a consistent title to make it “Dow 80,000.” The idea that the Dow can quadruple and not be too high is refuted by every valuation metric. I’m assuming if the authors think the Dow will move higher, they’re also bullish on the S&P 500. The S&P 500 Shiller PE is near 29. It would be the highest ever if the stock market quadrupled. By saying stocks wouldn’t be too high if they quadrupled, they are making the clear point that valuations don’t matter to them. Considering that valuations are the only way to determine if stocks are too high, eliminating them as a reference point allows for this statement.
The article says “Over the long term stocks in the aggregate are actually less risky than Treasury bonds or even bank certificates of deposit.” This statement is wrong because the reason why stocks have returned more than government bonds is because of the equity risk premium. If you think stocks have less risk than CDs, then you must have started investing after 2008. Stocks have much higher returns than CDs because investors take the risk of possible loss of capital.
The article reads like a sales pitch saying that stocks are “in the midst of a one-time-only march to higher ground.” However, the article isn’t selling anything, so everyday investors may believe the article because the authors seem to have good intentions. It puts the term “valuation metrics” in quotes like I just did, as if to say they aren’t real. The authors make up their own metric called perfectly reasonable price or PRP. Somehow a made-up metric is more real than the traditional ones.
The article claims stocks are always great investments because they have done well in past instances which were governed by turmoil and wars. This is a terrible explanation because stocks are valued by future cash flows. The companies aren’t the ones who fought in the world wars. In fact, the defense industry benefited from the wars.
The article also claims “that you can pick any lengthy period you want” and stocks will always have great performance. This is faulty logic for two reasons. Firstly, the same thing was said about real estate. Housing prices had never fallen on a nationwide basis. Therefore, it made sense to invest in them. In a weird ignorance of history, the authors write “never in American history has a diversified basket of stocks failed to double in buying power over a generation. Never.” Sometimes something that has never happened, happens right when everyone thinks it won’t. Stocks are not a special asset class which is immune to the speculative nature of investors. It’s easier to speculate in stocks than in real estate. The second reason this is wrong is because investors are very time sensitive even if they are investing for the long run. Once retirement comes, if stocks are in a bear market, investors will be hurt because they need to sell them to fund living expenses. They may be able to wait a few years, but they will never know when stocks will rebound.
The article states that stocks tend to “obey a kind of reversion to the mean.” You would think the writers would realize that this is the second longest bull market ever which means a mean reversion would send stocks lower. However, in this perverted definition, a mean reversion only means after stocks fall, they always rebound. The article says “the worst twenty-year period, from 1929 to 1948, the total gain was 84 percent.” However, it fails to mention that amounts to a 3.1% compound annual growth rate. The Shiller PE of stocks in 1929 turns out to be near where it is now; I’m expecting a similar poor performance in stocks for the next 20 years.
While I don’t think the market’s dividend yield is a great way to measure the valuation of stocks, the explanation of why it’s a bad indicator in this article shows a lack of intellectual integrity. It says “Certainly, a high yield may be a signal that a particular stock is attractively underpriced. But a low yield tells us very little about whether the market is dangerously overpriced.” The article never mentions data on why a high yield on individual stocks is good. It can be a red flag if the payout ratio shows the dividend is unsustainable. The article follows the premise that because stocks have gone up historically, every indicator which tells investors to be cautious should be ignored and every indicator which is bullish should be followed.
Because this article has 29 pages worth of writing, I will stop here and finish my counterpoints in another future article.