The higher the market goes, the larger the crash will be when it unwinds. That’s the way I look at the latest rally in stocks which finally put the Dow over the 20,000 mark. The tight range was finally broken in a big way today as each major index, including the Russell 2000 was up more than 0.75%. It’s tough to say what the catalyst of today’s rally is other than the continued momentum from the rally which began on Election Day. The longer this rally continues, the higher my conviction level is that this is the final blow off rally in this bull market.
The VIX is extremely low on historical standards which is bearish for the market because we are near peak stability. According to Walter Murphy Global Investment Advisors, only 1.9% of VIX readings in the past 27 years were lower than yesterday’s reading. The VIX is down an additional 3.43% today, so the 1.9% stat may be even lower. A low VIX doesn’t mean stocks are ready for a crash on its own, but when it’s combined with a Shiller PE of 28.48 and an economy which has been in recovery mode for 8 years, it’s a signal for extreme caution. The lowest the VIX has been is 9.97. Being that it’s now at 10.69, I can see it breaking through that all time low in the next few days.
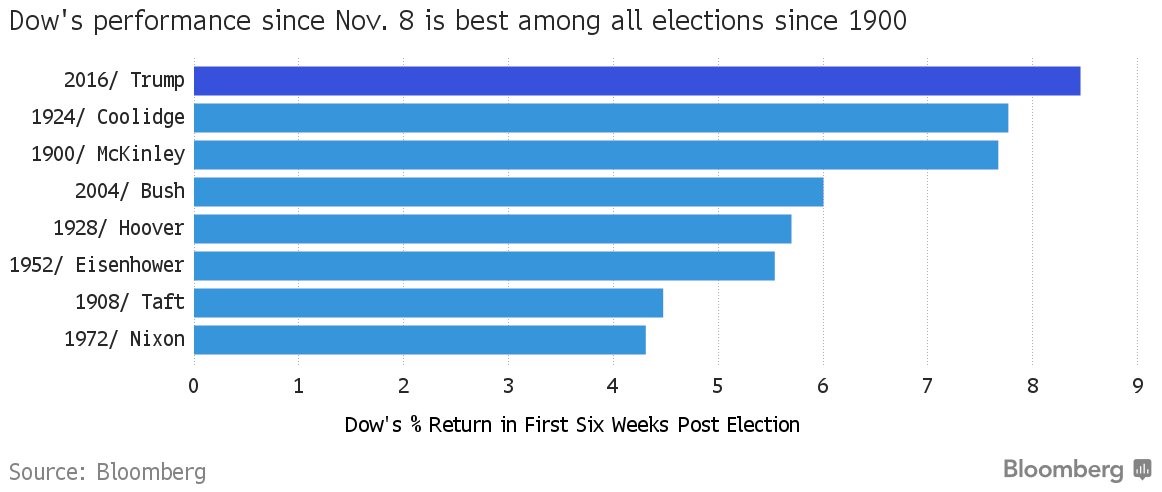
The chart below is another example of the strength of the rally. The statistics which put this post-election rally in perspective need to use the Dow Jones Industrial Average because the S&P 500 hasn’t been around long enough. The S&P 500 started including 500 stocks in 1957. When 50 years of data isn’t enough to capture a bubble, you know it’s very large. As you can see, the Dow’s over 8% rally in the 6 weeks since November 8th was the largest post-election surge since 1900. Keep in mind that the Russell 2000 did even better.
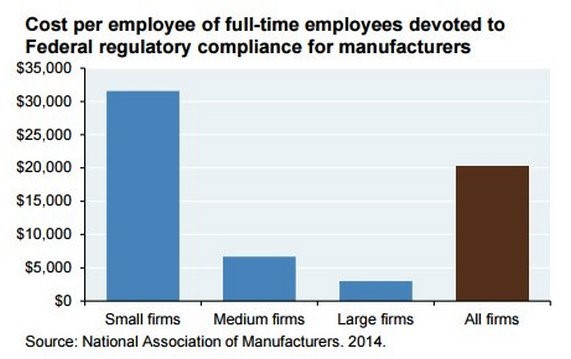
It’s not that small caps won’t benefit from the deregulation trend promoted by the Trump administration. However, since the rally started from expensive levels, it’s not justified. I have spoken about the cost benefit small caps will get over large caps. This is quantified in the chart below. Small manufacturing firms have about 10 times the cost per employee due to regulatory compliance compared to large firms. This is because the cost is mainly fixed. The biggest costs are figuring out what the regulations mean and how to apply them. The only variable cost is the amount of production plants they need to be applied to. I view this cost structure as effectively making it illegal to run a small manufacturing firm.
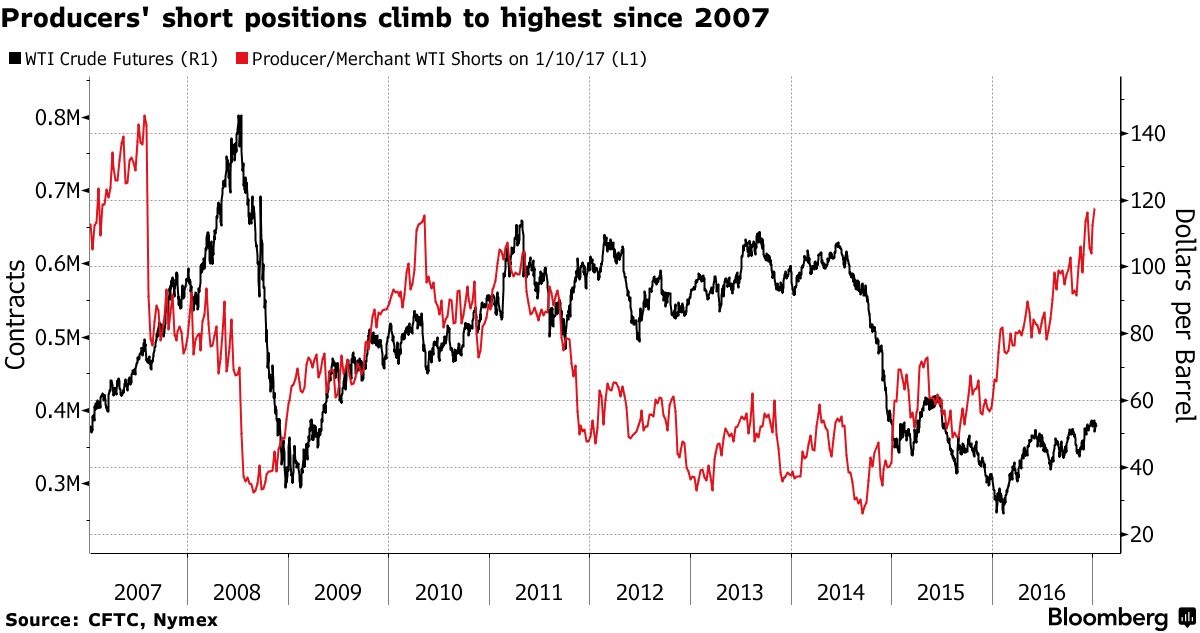
When I said energy stocks would be helped by Trump’s deregulation, that’s a strictly policy discussion just like the one with small cap stocks. At the margin these are positive effects, but I think the negatives outweigh the positives. In a previous article, I mentioned energy producers’ short positions in WTI were reaching extreme levels. This means they think the price of oil is too high relative to the supply and demand balance. I now have a Bloomberg chart which details this situation. The short positions are the highest level since 2007 when WTI hit $147 at its peak before crashing into the $30s. There is a counterpoint to this being a bearish signal. In 2010, the short positions hit just below where it’s at now and the price of oil didn’t crash. I think producers had bad memories of the crash in 2008, so they wanted to lock in the higher prices. The same thing could be happening now as producers have vivid memories of the 2014 crash and want to lock in the current prices.
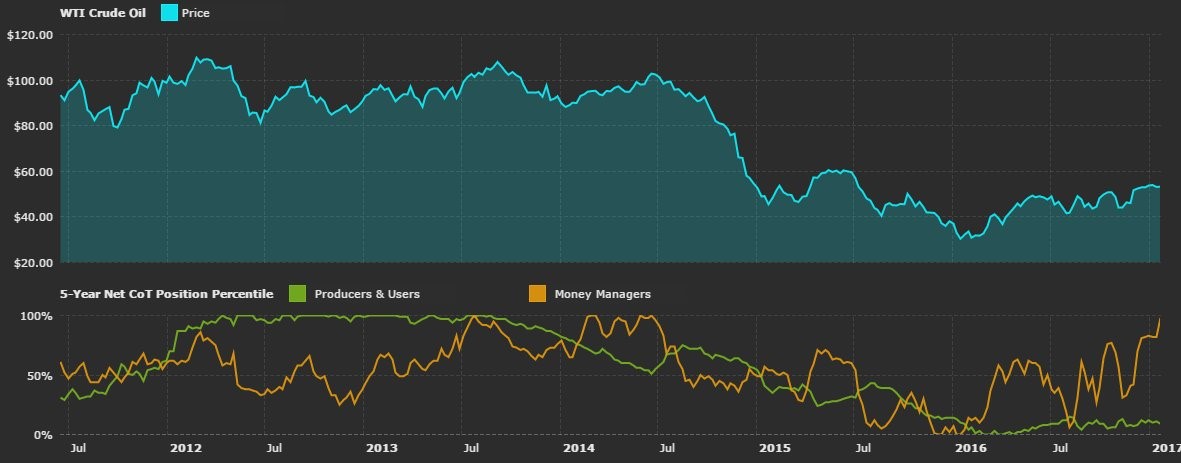
A counter to this devil’s advocate point I made is the chart below. The CoT position index ranks the spread between commercial and speculative positions. The Net CoT index is calculated by subtracting the short contracts from the long contracts. Therefore, it shows money managers are as long as they were in 2014 before the crash while both producers and users are both highly short. It could be the signal of a top in oil prices. Money managers invested an additional $2.6 billion in long positions last week.
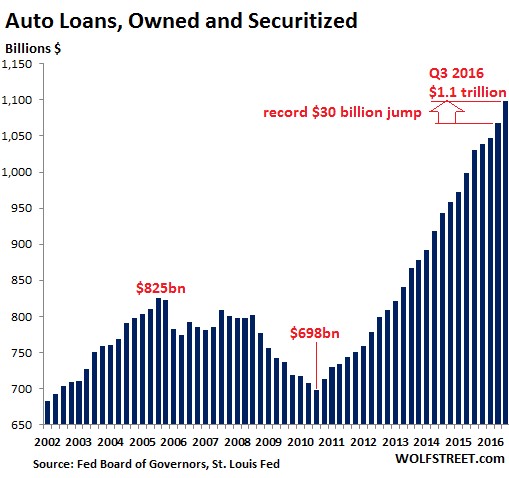
We have new information in regards to the auto market bubble. To recap, there was a stall in auto sales in the middle of last year, so firms started discounting to spur demand. In the last few years there has been movement to offer buyers with low credit scores loans to buy cars. This was my indicator to believe the bubble is about to burst sometime in the next few quarters. The chart below gives you a recap of the owned and securitized bubble in the auto loan market.
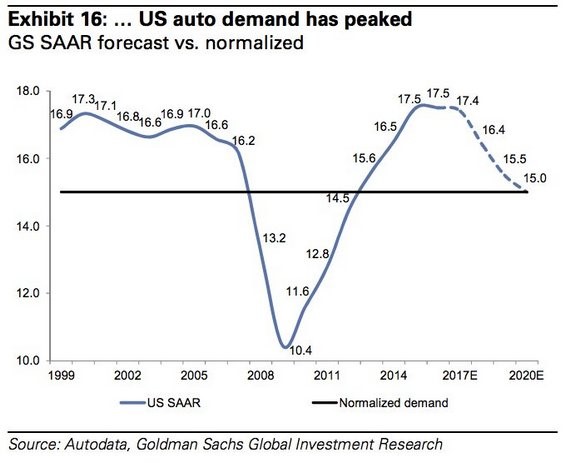
The chart below shows Goldman Sachs’ forecast of the auto loan market. SAAR stands for seasonally adjusted annual rate. Goldman is forecasting a peak in auto sales like I am projecting. The optimism surrounding the Trump presidency may lengthen the plateau, but it is going to come down soon. The plummeting demand for cars will hurt auto-makers and the parts firms.
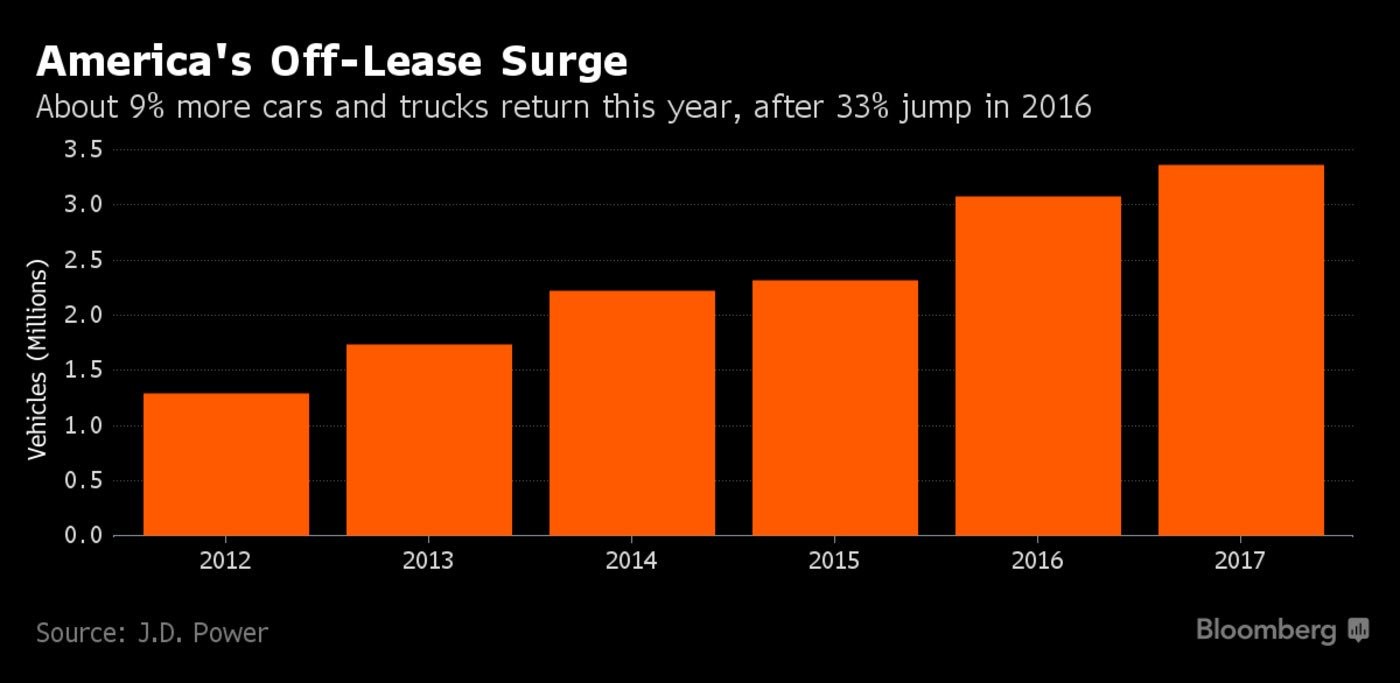
Demand isn’t the only issue with the auto market. The large increase in leases in the past few years is causing the number of cars and trucks coming off leases in 2017 to increase. There will be a 9% increase in cars and trucks coming off leases which adds to the 33% increase last year, as you can see in the chart below. Increased supply and decreased demand is a big problem. If the economy falters, the subprime loans will start to go soar at an accelerated rate. The increase in subprime loans looks great when the cycle is bullish because it inflates sales, but it looks horrible when the debt cycle becomes stressed. December auto incentives increased 23% year over year which amounts to $3,766 per vehicle. This is an unsustainable trend which will end this year.
Conclusion
The rally in stocks caused the Dow to hit the 20,000 mark. The low VIX is a signal for me to get nervous about a correction. The oil market continues to see excess speculation by money managers. The price should fall in the next few months. The auto industry looks stretched. It can’t keep increasing the discounting because margins can only be eroded so much. I’m looking for a decline in auto sales in the next few years as Goldman is projecting.
1 Comment
Wayne Callaway
January 25, 2017The Market can't go much longer! Too many negatives setting up!