
How Sector Rotation Reveals What the Market Is Really Doing — Before the Headlines Do
The headlines will always tell you what happened.
But by the time they do, the move is already over. The traders who acted have already been paid. Everyone else is left scrambling.
Here's the thing: the market wasn't hiding. It was talking. It's always talking.
Most people just don't know how to listen.
Sector rotation is one of the clearest signals the market sends. And right now... it is screaming.
What Sector Rotation Actually Is
Think of the stock market as a giant economy inside of an economy.
It has eleven distinct sectors — Technology, Energy, Healthcare, Consumer Staples, Utilities, Financials, and more. Each one behaves differently depending on where we are in the economic cycle.
Here's the key insight: money never sits still.
Big institutional money — the kind that moves markets — is constantly rotating. It moves out of one sector and into another. And where it goes next tells you more about the future than any news story ever could.
That rotation is the signal. The news story is what comes after.
Most retail traders ignore sector rotation entirely. They chase individual stocks. They react to earnings. They scroll Twitter trying to guess the next headline. And they wonder why they always feel one step behind.
The reason is simple. They're watching the wrong thing.
The institutions aren't making decisions based on this morning's CPI report. They're making decisions based on where they see the cycle going. They vote with their money. Every single day. In real time. Right there in the sector data — if you know how to read it.
The result? Institutional money tends to be early. It starts rotating weeks or even months before the headlines catch up. By the time CNBC is talking about defensive sectors, the institutions have already been there for a month. This is the gap that sector rotation analysis closes.
When you can read that data, you stop reacting to the news and start anticipating the next move.
That is the edge. And it doesn't require a Bloomberg terminal or a Wall Street address. It just requires knowing what to look for — and where.
The Late Cycle Playbook
Every market cycle follows a similar script.
Early in the cycle, money floods into growth:
- Technology leads
- Semiconductors lead
- Consumer Discretionary leads
- The Nasdaq makes new highs before the Dow
That's the phase where fortunes get made. Chart patterns are clean. Breakouts hold. You stay long, stay aggressive, and let your winners run.
But the cycle doesn't last forever. Nothing does.
Eventually the economy matures. Growth expectations moderate. Credit conditions tighten. Corporate margins compress. The earnings acceleration that drove the bull run starts to slow.
And when that happens... money gets smart. It starts looking for the exits.
Late in the cycle, the script flips.
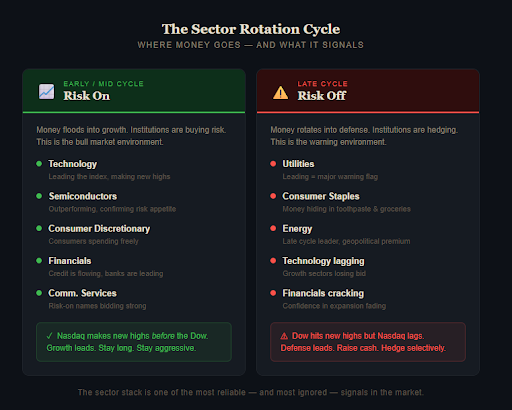
Money migrates out of growth and into defense. These are the sectors people hide in when they sense trouble ahead:
- Utilities — stable dividends, boring business models. Boring is beautiful when you're nervous.
- Consumer Staples — people keep buying toothpaste and groceries no matter what the market does.
- Energy — oil demand holds up late in the cycle, and geopolitical risk adds a premium.
When you see those three sectors on top of the leaderboard week after week? That's the market saying something. Loudly.
That is exactly what has been playing out in February 2026.
What the Sectors Are Telling You Right Now
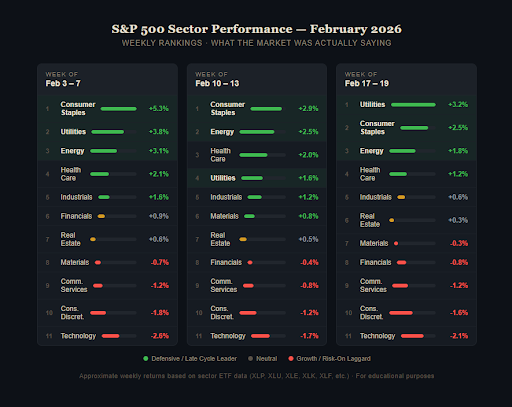
Let's look at the evidence.
Consumer Staples was the top performing sector the week of February 3rd — up more than 5% that week alone. The week of February 10th, same story. Staples on top.
And Utilities? Utilities ran the table the week of February 17th. Best performing sector by a wide margin.
Meanwhile...
- The Nasdaq hasn't hit a new all-time high since October 2025
- The technology sector has returned negatively since the start of Q4 2025— five months of negative returns in a sector that makes up 30% of the S&P 500
- Energy has been the top performing sector year-to-date
Utilities. Staples. Energy. That is a late cycle sector stack. No ambiguity. No gray area. The data is right there for anyone willing to read it.
The Mag 10 Problem
Here's something most people don't talk about enough.
Ten stocks make up 40% of the S&P 500. Ten.
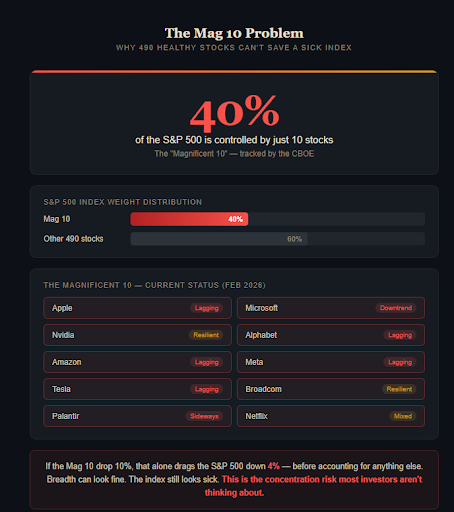
The Magnificent 7 plus a handful of others — what the CBOE now tracks as the "Magnificent 10." These are the biggest weights in the index. And right now, they are the weakest part of the market.
Microsoft is in a downtrend. Palantir is going sideways, bleeding off its highs. The broader software sector is reeling from the AI disruption narrative.
When these names struggle, the index struggles — even if the other 490 names in the S&P are doing fine.
This is why market breadth can look healthy on the surface and the index can still feel sick. More stocks are hitting new 52-week highs, yes. But the ten names that carry the most weight? They're being sold.
Here's the math that makes this real. If the Mag 10 collectively drop 10%, and they represent 40% of the index, that alone drags the S&P down 4% — before accounting for anything else happening in the market. Meanwhile, 400 stocks could each be up 1% and it barely makes a dent. The index math is brutally unforgiving when the biggest names are struggling.
That's not bullish. That's a warning shot.
Financials Gave You a Warning Too
Here's one people missed.
Financials broke down hard in early February. Lower high, followed by heavy selling. Banks and brokerages make more money when the economy is humming. When institutional money starts pulling out of financials, it's telling you something very specific: confidence in the expansion is starting to fade.
The same week Financials rolled over, Utilities was bidding hard.
That's not a coincidence. That's the signal.
And here's one more to watch: the Japanese Yen.
When the Yen surges, it unwinds what's called the "carry trade" — a massive global bet where investors borrow cheap Yen and invest it in higher-yielding assets like US equities. This trade has been a quiet fuel source for the US bull market for years. Most retail investors have no idea it even exists.
When those trades get unwound, the selling pressure is fast, mechanical, and has nothing to do with earnings or fundamentals. It's pure forced liquidation. Stocks get sold not because anyone thinks they're bad businesses — but because someone somewhere needs to close a Yen-funded position.
Watch the Yen. Seriously.
"But Isn't This Still a Bull Market?"
Yes. And this is the nuance that matters.
This is not a call to panic. The long-term trend is still up. The intermediate trend is still up. Market breadth is actually expanding in many areas.
The Russell 2000 is holding up. Industrials have been resilient. Healthcare has been steady. There is genuine breadth underneath the surface. The whole market is not broken.
In fact, the number of stocks hitting new 52-week highs has been expanding lately. More names are participating. That's a real data point and it deserves respect.
But short-term? There are real risks. And ignoring them is how traders give back months of gains in a matter of days.
Here's what most people don't appreciate about index math: when 10 stocks make up 40% of the S&P 500, those 10 names dominate the return. It doesn't matter how many other stocks are doing well. If the Mag 10 are sick, the index looks sick. Period.
The right read on this market is simple: long-term bull, short-term cautious.
Hold cash. Hedge selectively. Wait for the setup. The sector rotation will tell you when the signal shifts back.
What a Bottom Looks Like
So what would change the picture?
A real market bottom almost always involves a broad liquidation event. Not a quiet drift lower. A flush. Everything gets sold — defensives, gold, crude oil, even treasuries for a brief moment. That's capitulation. That's when everyone throws in the towel at the same time.
Watch for it. You'll see:
- Utilities pulling back
- Staples selling off
- Gold and silver getting hit
- Energy dropping
And at the same time, the growth sectors — tech, semis, consumer discretionary — starting to show relative strength on down days.
When the market drops 2% but semiconductors only drop 1%... that's your early signal. That's when the rotation is beginning to reverse. That's when you start leaning in.
It's subtle at first. But once you've seen it a few times, it becomes unmistakable.
The S&P has been range-bound between roughly 6,500 and 7,000 for over four months. We're due for a resolution. The sector data suggests it comes down first — a retest of the November lows around 6,500, maybe a touch lower.
That could be the biggest and best buying opportunity of 2026.
But you have to be patient enough to wait for the confirmation. Don't catch the falling knife. Watch the sectors. Let the data tell you when the tide has turned.
How to Use This in Your Own Trading
You don't need a fancy terminal to track sector rotation. You need a habit.
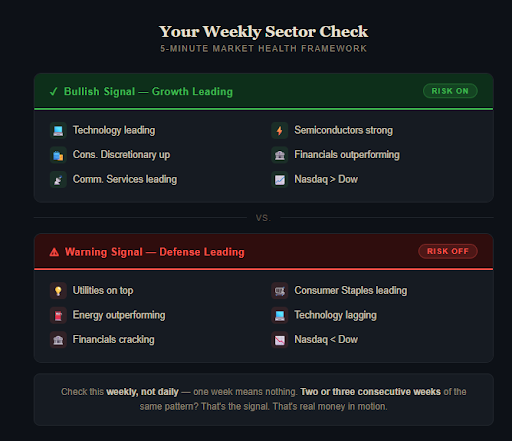
Every weekend, pull up the sector performance leaderboard. It takes five minutes. Finviz.com has a free version. Most brokerage platforms show it too. Look at what's leading and what's lagging. Ask yourself one question:
Is this a growth-led market or a defense-led market?
Bullish signal — growth leading: Technology, Semiconductors, Consumer Discretionary, Communication Services, Financials at the top.
Warning signal — defense leading: Utilities, Consumer Staples, Energy at the top while Tech lags.
Track this week over week. Not day by day — that's too noisy. One week of Utilities leading doesn't mean much. Two or three consecutive weeks? That's a trend. That's the signal.
You can also track the Nasdaq vs. the Dow. In a healthy bull market, the Nasdaq leads — it makes new highs first. When the Dow is hitting new highs but the Nasdaq is making lower lows... the smart money is rotating away from growth.
The Dow is a price-weighted index of mostly old-economy, blue chip companies. It's built differently than the Nasdaq. The Dow can look just fine while the growth engine of the market is quietly deteriorating underneath it. Don't let a Dow new high fool you into thinking everything is healthy.
The Nasdaq has not seen a new all-time high since October 2025. That single data point says more than a dozen news segments ever could.
The Bigger Picture
Here's what actually excites me about the current setup.
We've been in a 500-point trading range on the S&P 500 for over four months. Every dip triggers a short squeeze. Every rally brings out the complacent bulls. It's been exhausting for everyone trying to make money in it.
That kind of range doesn't last forever. Eventually it resolves.
And when it does... the sector data will show you first.
A move down to 6,500 from current levels is roughly a 4.5% correction. That is not the end of the world. That is a run-of-the-mill correction in a longer-term bull market. These happen. They're supposed to happen. And they create opportunity for traders who are paying attention.
Think about it this way. If you know a sale is coming, you don't spend all your money at full price today. You hold cash. You wait. And when the panic sets in and everyone around you is selling, you step in and buy what you wanted at a discount.
That's what the patient trader does right now.
Corrections in the 5-10% range during secular bull markets have historically been the best entry points for the next leg higher. The second half of this year has the potential to be very strong. New all-time highs before year-end are still very much on the table.
Think about the bigger picture for a moment. We are in what market historians call a secular bull market — a long-term expansionary period that can last a decade or more. Since the 1980s, we've seen 18-year expansionary cycles that produced over 1,200% gains. These cycles have corrections. They have scary patches. But the trend is up until it isn't.
Right now, we are in one of those cycles. The secular trend is intact. The correction we're watching unfold is noise on that bigger chart. It matters for timing and entry points. It does not mean the bull market is over.
But to maximize that opportunity, you need to be positioned correctly right now. Patient. Defensive. Cash heavy. Waiting for the signal to flip.
And when it does? The sectors will tell you first.
What This All Comes Down To
The market never lies. It just requires translation.
Sector rotation is that translation. It strips away the noise — the Fed headlines, the tariff drama, the earnings beats and misses — and shows you where institutional money is actually flowing.
Right now, that current is defensive. It is cautious. It is late cycle.
But currents shift. And when this one does, the opportunity on the other side is going to be significant.
This is why I track sector rotation relentlessly — every session, every week, every quarter. It's not glamorous. Nobody makes a YouTube thumbnail out of sector leaderboards. But it is one of the most reliable, repeatable signals in all of market analysis. And it has been right for the past two months running.
The traders who followed the sectors in early February — who saw Staples and Utilities taking the top spots while tech was fading — had time to build their cash positions, put on their hedges, and prepare. The traders who were glued to the news were caught off guard.
Start watching the sectors every week. Make it a habit.
Because the traders who act before the headlines are the ones who get paid. And the sectors will always tell you what's coming next — if you know how to listen.
Gianni Di Poce is a breakout specialist and trend trader with over 14 years of experience in the markets. He is the creator of the Trinity Terminal and runs the Million Dollar Challenge portfolio at TheoTrade.com.