

A couple weeks ago, I shared a really intriguing trade recommendation for Nvidia, which has become the largest and most important stock in this market. My trade instructions were: “Buy NVDA on a close above $950.02 with a stop loss on a close below $887.47. Target $1200.”
I sent out the trade on May 16, and it triggered on May 21. After a solid rally for a couple weeks, it hit my upside target of $1200 on June 5, leaving fellow traders with a solid 26% gain against a barely 0.05% rise in the broader market. Here’s how and, just as importantly, why we put on the trade in the first place…
Confession: I’m a Big Chart Guy
I’ll level with you here… I can’t tell you how many hours over the last 12 years or so I’ve spent observing trends, patterns, and momentum. I wouldn’t go as far as calling it an obsession, but it’s definitely a passion of mine. Let’s start off by looking at the trend of NVDA’s daily chart below - what do you see?
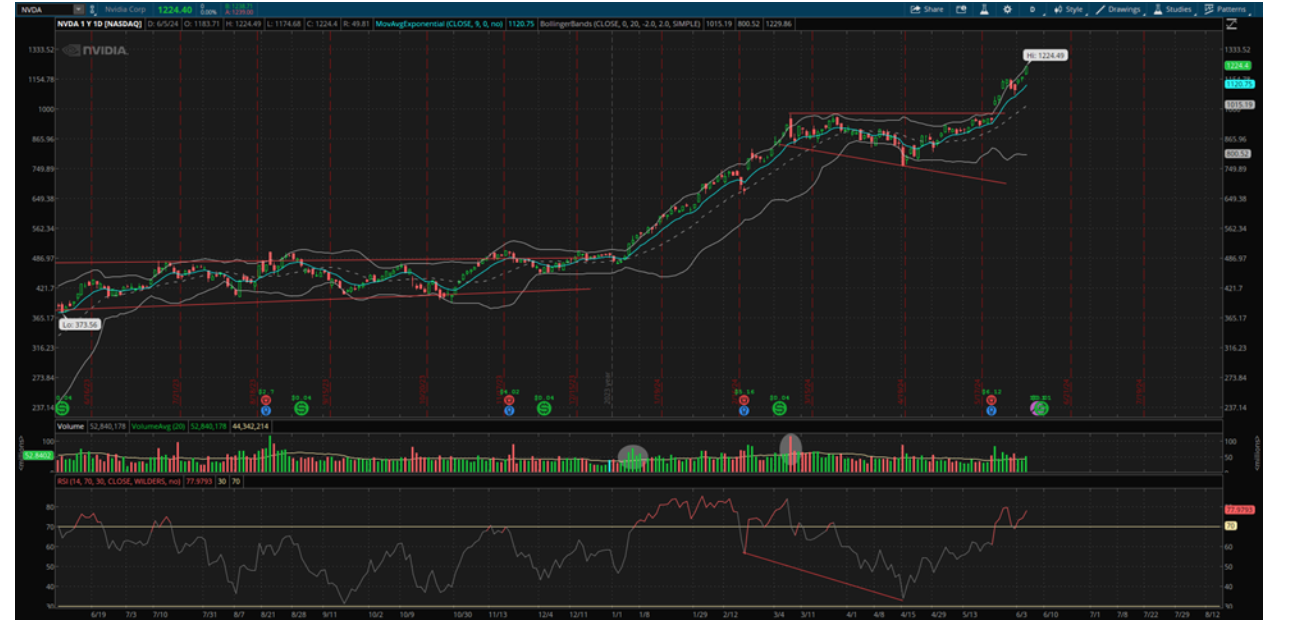
The obvious answer is an uptrend. This is characterized by a series of higher highs and higher lows. Was that enough to justify my call to buy? Not quite.
Have a look at the wedge formation I drew on the chart between February and April. I love these patterns - they often lead to an acceleration of upside momentum in a trending market, and offer a quick way for traders to pursue profits with minimal risk.
There’s more to this trade that I could explain to you, but let’s keep it simple for now.
I’m just glad that we closed the trade before the 10-for-1 share split on June 10, and before this thing blows.
Of course, that doesn’t mean it can’t continue higher near-term, but I hope this trade helps you understand that there’s plenty of “red meat” to be had in the middle of price moves. I don’t need to nail the exact high or low to make money, and neither do you. If you saw my original recommendation, you know I told everyone that bubbles offer one of the easiest ways to make money in markets - if you know what you’re doing.
Talk again soon...