The equities market has rallied on the anticipation of the Dow hitting 20,000. It’s an irrelevant factor for fundamental investors, but it matters to traders who look to push the market higher. The market has looked to push higher since the election as momentum reigns supreme. It’s a weird concept to say that the market wants to go higher because in theory the market should represent future cash flows of corporations. However, as we’ve seen with the past two bubbles, that theory doesn’t work out in practice.
I will continue to discuss the theme of the overexuberance in the market until something changes. Either the economy can start growing at 3% and profits growth can reach the 11% growth expectations or the market can fall. As you can tell by the market’s action today and the lack of earnings reports, neither of those things happened today.
We received interesting data on buybacks and market sentiment which I will review in the article. The headline news from FactSet is shown below. Q3 buybacks were $115.6 billion which amounts to a 28% decrease year over year. It’s the least amount of buybacks since Q1 2013. As you can see from the blue line in the chart below, 362 companies in the S&P 500 bought back stock which the second lowest amount in the past 4 years.
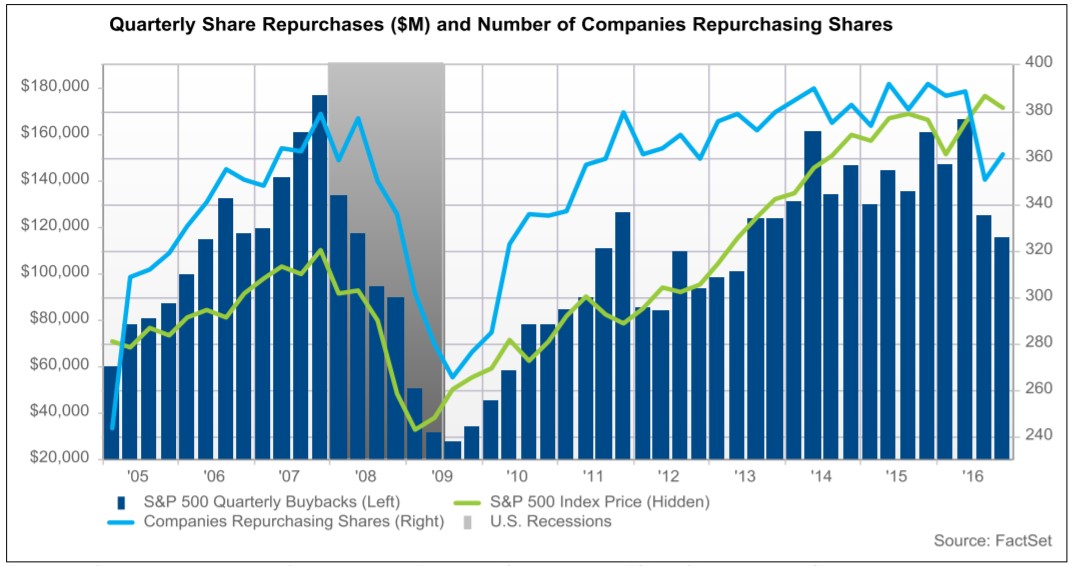
The chart above looks dire because the fall in buybacks is mimicking the last fall in early 2008. However, the situation is much different in good ways and in bad ways. The most obvious difference is the banking system isn’t near collapse and the economy likely isn’t in a recession. While I am a bear on the market, I don’t expect to see the decline in buybacks continue at the same rate as it has been falling at. The reason is earnings have stabilized. The negative difference is stocks are more expensive and interest rates are rising. Some may conclude that buybacks are declining because managements believe their stocks are overvalued. I don’t give them that much credit; I expect if earnings do improve in 2017, buybacks will perk up again. Rising interest rates would hurt the ability of firms to borrow money cheaply to fund buybacks.
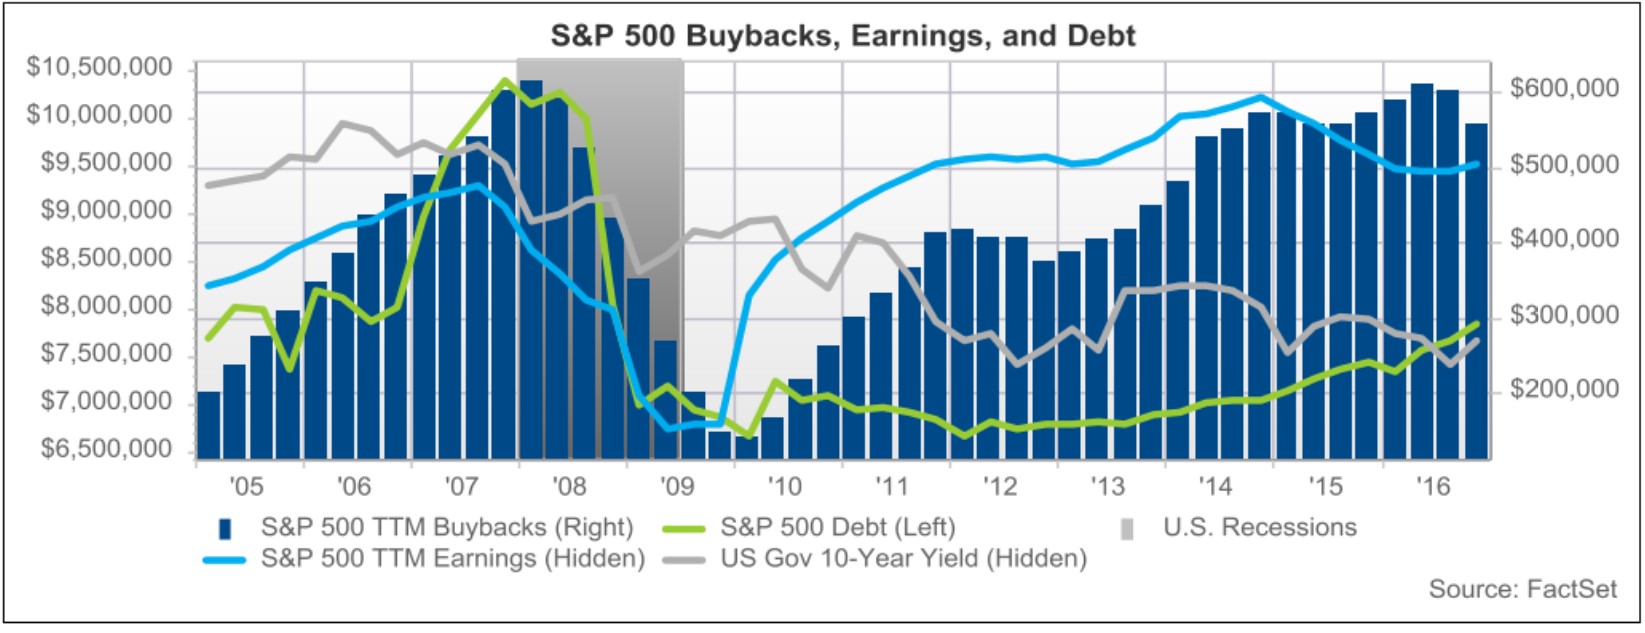
The chart below shows the 10-year bond yield and the S&P 500 debt level. Rising yields combined with earnings declines would be the worst-case scenario for buybacks because there would be no way to fund them. I do not know why the FactSet debt level is so low because according to Morgan Stanley the leverage on investment grade balance sheets is at record highs. The way the debt is calculated must be different because the debt is much lower than in 2008 in this chart. If earnings decline and interest rates rise, leverage will skyrocket higher which will eventually lead to defaults. Sometimes data points can be manipulated, so it’s important to investigate various sources. At the end of last quarter, I saw different metrics of how fast earnings growth was. It’s important to remain objective. It’s very easy to fall into the trap of only believing data which supports your perspective.
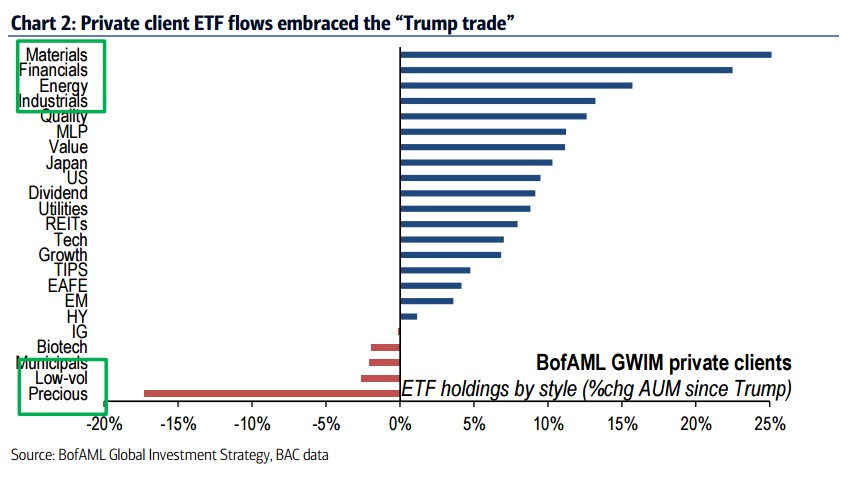
The bears have been completely wrong about the how the decline in buybacks would hurt the stock market. While buybacks do represent an important area of demand for stocks, the decline in buybacks has been more than soaked up by investors. The chart below shows the Trump trade in action as ETF buying in industrials and financials has increased. The market always likes to pick winners and losers whenever any new president is elected. That’s not to say this is a bad practice. Less regulations will help energy and financials’ profit margins. An infrastructure plan would help materials and industrials. The question is if everyone already bought these stocks is the rally almost over?
This type of information tells us what we already know. Of course, investors are bullish and inflows are up; the market is at a record high. Contextualizing the data helps us determine how close we could be to the end of this rally. Last week, Merrill Lynch stated the 4 prior days saw $21 billion flow into equity funds which was the 9th highest week ever. There was $31 billion that went into ETFs and $10 billion that left mutual funds. There is a trend towards passive investing. The conclusion inexperienced investors are coming to is if the market is going up, why pay someone to do what you can do for free? However, they will soon find out that part of why you pay money managers is they are supposed to limit losses. The passive investors will be crushed when the tide turns. Money will come out of passive investments and back into active management.
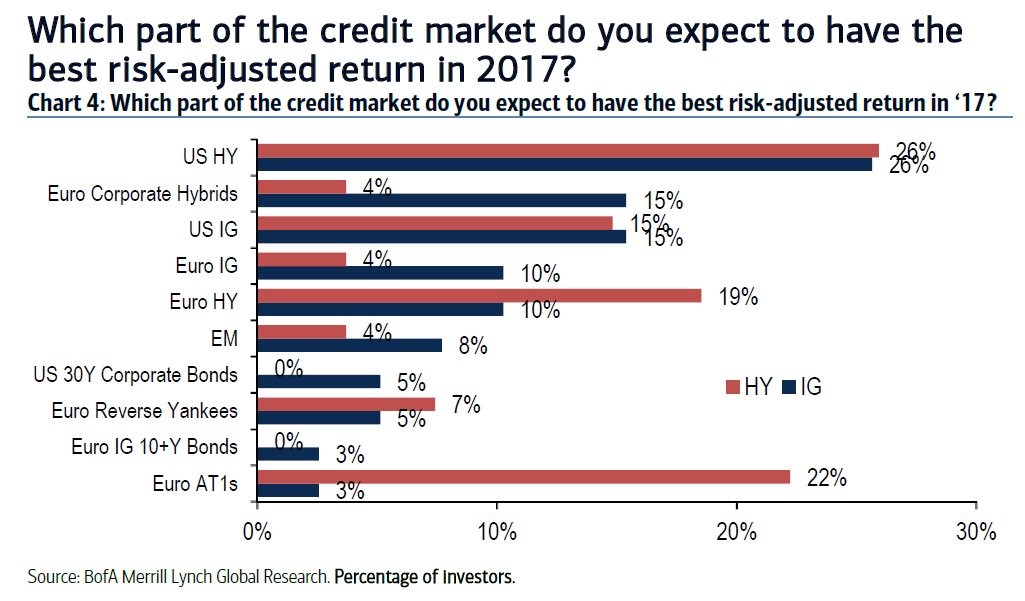
The chart below is very confusing, but does have interesting findings. The reason why it’s confusing to me is it separates U.S. high yield into two categories: investment grade and high yield. How can debt be high yield investment grade? That’s a contradiction. That must be why the numbers are the same for U.S. high yield and for U.S. investment grade. Ignoring this confusing flaw in this chart, it shows the bullishness from debt investors. High yield bonds were hated in February. Now they have returned to their glory. I was wrong in my estimation that the credit cycle would roll-over in the first half of 2016. Energy and mining debt made the overall default rates look worse than they were. Now that oil has rebounded, default rates are coming down. This false start doesn’t mean these bulls are correct. The recovery is still long in the tooth and will eventually end at some point within the next couple years.
Conclusion
You already knew investors were bullish by looking at the indices, but now you know how bullish they are. Inflows into ETFs are so strong that they have counteracted the decline in buybacks. It’s amazing how swiftly investors have gone from fearing Trump to loving him. It makes you wonder how quickly the switch can reverse. On the bullish side, I don’t expect buybacks to fall off a cliff as they did in 2008 because the earnings situation is better. That doesn’t mean you should buy stocks because they are more expensive now than they were in early 2008.